
We've been super busy at Report URI HQ and we have some awesome new features to tell you about! This isn't just a case of new features for Report URI though, these are things that will fundamentally change the kind of information we have available as site operators. Are you ready for this?
The Reporting API
By far the single biggest thing that we have to announce is that we're introducing support for 4 new types of report! Expanding out from our current offering of security based reports, these new reports will unlock a tonne of new information that we simply can't obtain any other way and range from performance and availaility issues to possible optimisations and failures in our sites. The Reporting API itself is currently a W3C Working Draft and Chrome will be releasing support in M70, released in the last few days. It defines new types of reports that the browser can send, which is awesome news for site operators to be able to gather more information about what's working and not working on their site, and a new method for sending reports, which is awesome for us because we can deliver an even more efficient service. I'm going to give a brief introduction to the Reporting API, what types of reports are supported and how we set it up and then I will do technical deep-dive posts on each one at a later date.
Deprecation
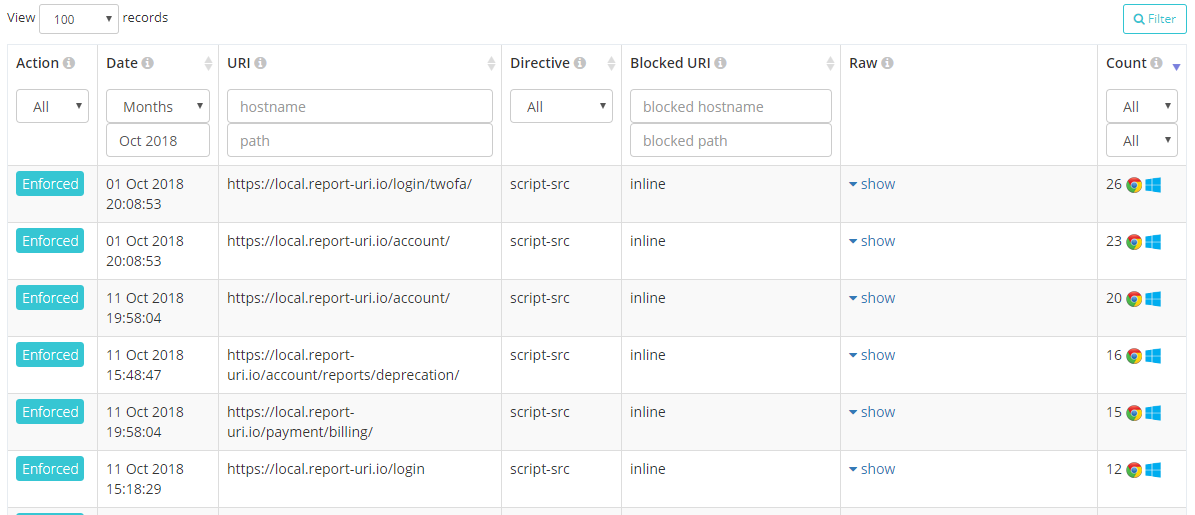
Deprecation reports will be sent by the browser when you use an API or feature that the browser vendor expects to drop support for in a future update. This will be really useful to site operators, especially when it's so hard to keep up to speed with the latest changes in browsers, and the great things is that you should only receive reports when something is going to break. Most of the time you won't get anything back but when you do, a report will show up in your account:
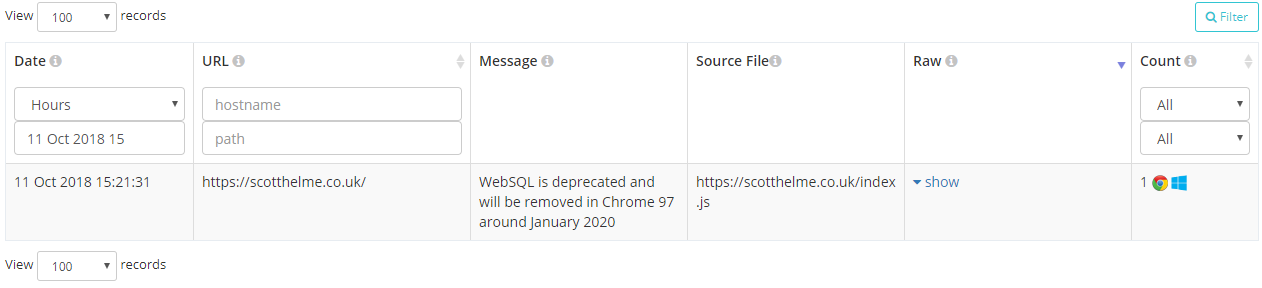
Of course if you want you can also inspect the raw report payload that we received, normalised and then processed into your account.
{
    "url": "https://scotthelme.co.uk/",
    "id": "websql",
    "anticipatedRemoval": "1/1/2020",
    "message": "WebSQL is deprecated and will be removed in Chrome 97 around January 2020",
    "sourceFile": "https://scotthelme.co.uk/index.js",
    "lineNumber": 1234,
    "columnNumber": 42
}
These reports will be really handy to identify issues on your site before they become issues and have them resolved before they cause problems in production.
Intervention
Intervention reports will be sent by the browser when it decides that it must change its behaviour in the interest of security, performance or to prevent it annoying the user. I'm sure many of us will have seen these kind of warnings in the console and common examples include the browser being on a slow network so making changes to how it loads resources, refusing to play sounds not initiated by the user, not allowing embedded frames to trigger a vibrate and the really frequent "Synchronous XMLHttpRequest on the main thread is deprecated because of its detrimental effects to the end user's experience".
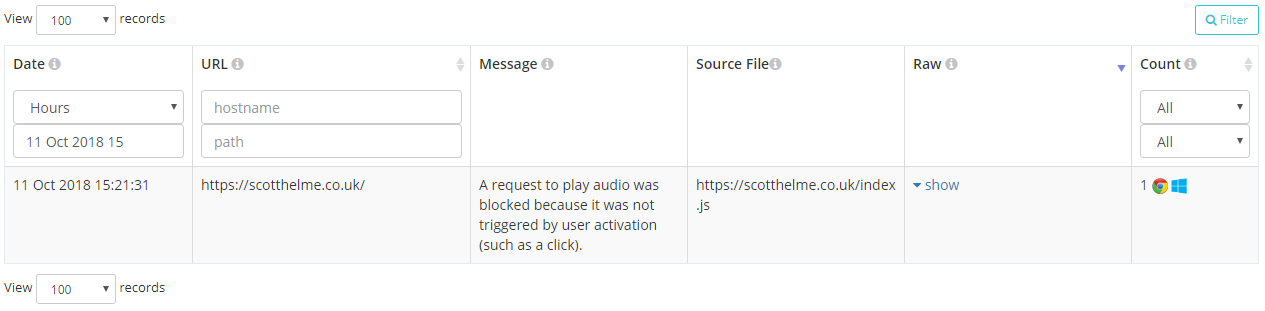
These reports will be super handy because it means that your users aren't getting the experience you expect and there could be something you could do to fix that. The report gives you all the information to know what happened, where and how frequently.
{
    "url": "https://scotthelme.co.uk/",
    "id": "audio-no-gesture",
    "message": "A request to play audio was blocked because it was not triggered by user activation (such as a click).",
    "sourceFile": "https://scotthelme.co.uk/index.js",
    "lineNumber": 1234,
    "columnNumber": 42
}
Crash
Crash reports are sent when a user was unable to continue using the page because the browser or one of its components crashed. Only limited details of the crash are transmitted for security reasons but it's enough to provide useful information to the site operator, especially if this is a common occurrence.
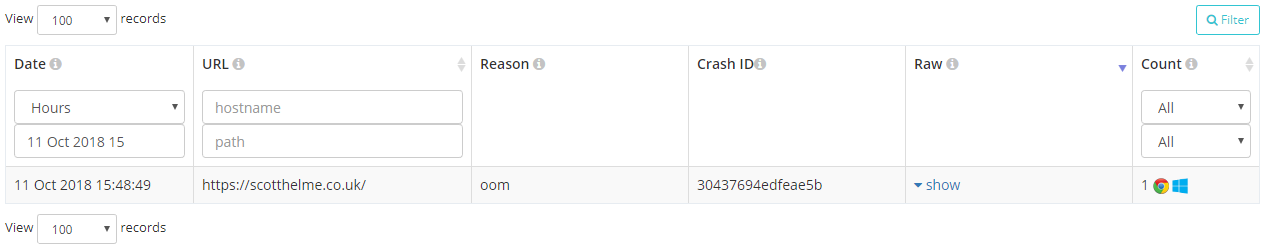
That particular report shows an 'oom' or Out Of Memory crash from the browser and the reports include a unique crash ID that isn't direct use to the site operator but could be used in talks with the browser vendor who would interpret that.
{
    "url": "https://scotthelme.co.uk/",
    "crashId": "30437694edfeae5b",
    "reason": "oom"
}
Enabling the Reporting API
These 3 new report types introduced with the Reporting API will allow developers and site operators to learn so much more information about problems in the user experience on their site. If something is going wrong when users are on your site you don't want to rely on them telling you because let's be honest most won't, I know I don't a most of the time. Being able to automatically and transparently collect these reports without having to place a burden on the user is a great opportunity and it's also really, really easy to enable too.
Report-To: {"group":"default","max_age":31536000,"endpoints":[{"url":"https://scotthelme.report-uri.com/a/d/g"}],"include_subdomains":true}You enable all of the above features by setting the Report-To HTTP response header which tells the browser where to send the reports when it needs to. Looking at the JSON value in the header we can break that down to be more readable.
{
    "group" : "default",
    "max_age" : 31536000,
    "endpoints" : [
        {"url" : "https://scotthelme.report-uri.com/a/d/g"}
    ],
    "include_subdomains" : true
}
The group value defines the name of this reporting group and default is the name that must be used for deprecation, intervention and crash reports to be sent to. You can create groups with other names for other report types, but more on that later. The max_age value states how long the browser should remember to send reports to this address for this particular site. Again, it will become clear later why the browser may need to remember this setting and not simply use it on a per-response basis. The endpoints array can contain objects where the define a url for where reports can be sent. You can have multiple endpoints and even weight them to have a fallback option in the event the browser can't reach your main reporting endpoint. Finally, the include_subdomains setting is fairly self explanatory and if this header was delivered by scotthelme.co.uk then the policy would also apply to all subdomains below that too. This means you can enable reporting for your entire origin if you so wish.
Network Error Logging
All of the new reports so far are great, but I've only covered 3 and I did say there were 4 new report types. Network Error Logging, or NEL, is going to provide us information that it was previously impossible or near-impossible to obtain and I can't wait to see widespread use of this mechanism. The problem with these headers and report delivery so far is that the policy is delivered as a HTTP response header and when something happens on the page, a report is sent. This is all based on the assumption that there is a page. That the user managed to connect, without one of countless possible things going wrong, managed to load the page and then finally hitting their error. Let's play through a few scenarios and think how that might now work. What if your DNS service is down, maybe not globally, but a particular set of users can't access it. They might not able to reach the service, resolve the domain or the DNS lookup could fail. All of these would prevent the user even getting to your site. Moving on from DNS to TCP we have connection timeouts, connection refused or failed errors that we see a lot. Again, if the user never actually connects then we can never hope to know they're having issues because we don't see them. There's even more too. What about an invalid or expired certificate, something we see a lot recently! All of these kind of errors throw up a full page warning in Chrome and mean the user never got to your site. The fault could be on their end or something out of your control, yes, but it could also be something that is your fault and that you could resolve if you knew it was happening. This is where NEL comes in.
NEL: {"report_to":"default","max_age":31536000,"include_subdomains":true}We deliver the NEL HTTP response header and in the header we declare our policy.
{
    "report_to" : "default",
    "max_age" : 31536000,
    "include_subdomains" : true
}
The report_to refers back to the Report-To header we setup earlier and tells the browser which report group to send the reports to, in this case we're using the default group we created. The max_age and include_subdomains values are the same again and states how long the browser should remember this preference for and deliver reports for network errors to this domain and all subdomains. What this means is that in the circumstances where users can't connect to your site, for whatever reason, and receive that full page error message, the browser can still dispatch a report and tell you about it. In that scenario you previously couldn't have received any data from that user because they didn't connect for whatever reason. Now you can and just look at all the errors the browser can report!
dns.unreachable
    DNS server is unreachable
dns.name_not_resolved
    DNS server responded but is unable to resolve the address
dns.failed
    Request to the DNS server failed due to reasons not covered by previous errors
dns.address_changed
    Indicates that the resolved IP address for a request's origin has changed since the corresponding NEL policy was received
tcp.timed_out
TCP connection to the server timed out
tcp.closed
The TCP connection was closed by the server
tcp.reset
The TCP connection was reset
tcp.refused
The TCP connection was refused by the server
tcp.aborted
The TCP connection was aborted
tcp.address_invalid
The IP address is invalid
tcp.address_unreachable
The IP address is unreachable
tcp.failed
The TCP connection failed due to reasons not covered by previous errors
tls.version_or_cipher_mismatch
The TLS connection was aborted due to version or cipher mismatch
tls.bad_client_auth_cert
The TLS connection was aborted due to invalid client certificate
tls.cert.name_invalid
The TLS connection was aborted due to invalid name
tls.cert.date_invalid
The TLS connection was aborted due to invalid certificate date
tls.cert.authority_invalid
The TLS connection was aborted due to invalid issuing authority
tls.cert.invalid
The TLS connection was aborted due to invalid certificate
tls.cert.revoked
The TLS connection was aborted due to revoked server certificate
tls.cert.pinned_key_not_in_cert_chain
The TLS connection was aborted due to a key pinning error
tls.protocol.error
The TLS connection was aborted due to a TLS protocol error
tls.failed
The TLS connection failed due to reasons not covered by previous errorshttp.error
The user agent successfully received a response, but it had a 4xx or 5xx status code
http.protocol.error
The connection was aborted due to an HTTP protocol error
http.response.invalid
Response is empty, has a content-length mismatch, has improper encoding, and/or other conditions that prevent user agent from processing the response
http.response.redirect_loop
The request was aborted due to a detected redirect loop
http.failed
The connection failed due to errors in HTTP protocol not covered by previous errorsabandoned
User aborted the resource fetch before it is complete
unknown
error type is unknownI can't express how much I'm looking forward to the potential of NEL. Being able to know we have DNS resolution issues or an expired cert or any of the things listed above is awesome and it's never been this easy to do. Just think about DNS monitoring alone, having vantage points all around the globe to check your DNS is resolving is a pretty tall order. How about using potentially millions of vantage points by leveraging browsers with a few simple lines of config? I think this is going to unlock so much information and make it accessible to site operators and I'm looking forward to hearing your stories about using it.
New Account Homepage
I really didn't like our old account home page and it was top of my list for things in the UI to fix. It was awful, and it's ok to admit when you got something wrong. I'm a developer and not a designer so it sucked and I looked around for inspiration on how to make it better. I wanted it to be useful, I wanted it to give you information at a glance that you actually wanted and I think we've made a really significant improvement here. The old statistics that were there and how we presented them just didn't scale and wasn't useful. So, with that, I present our new account homepage.
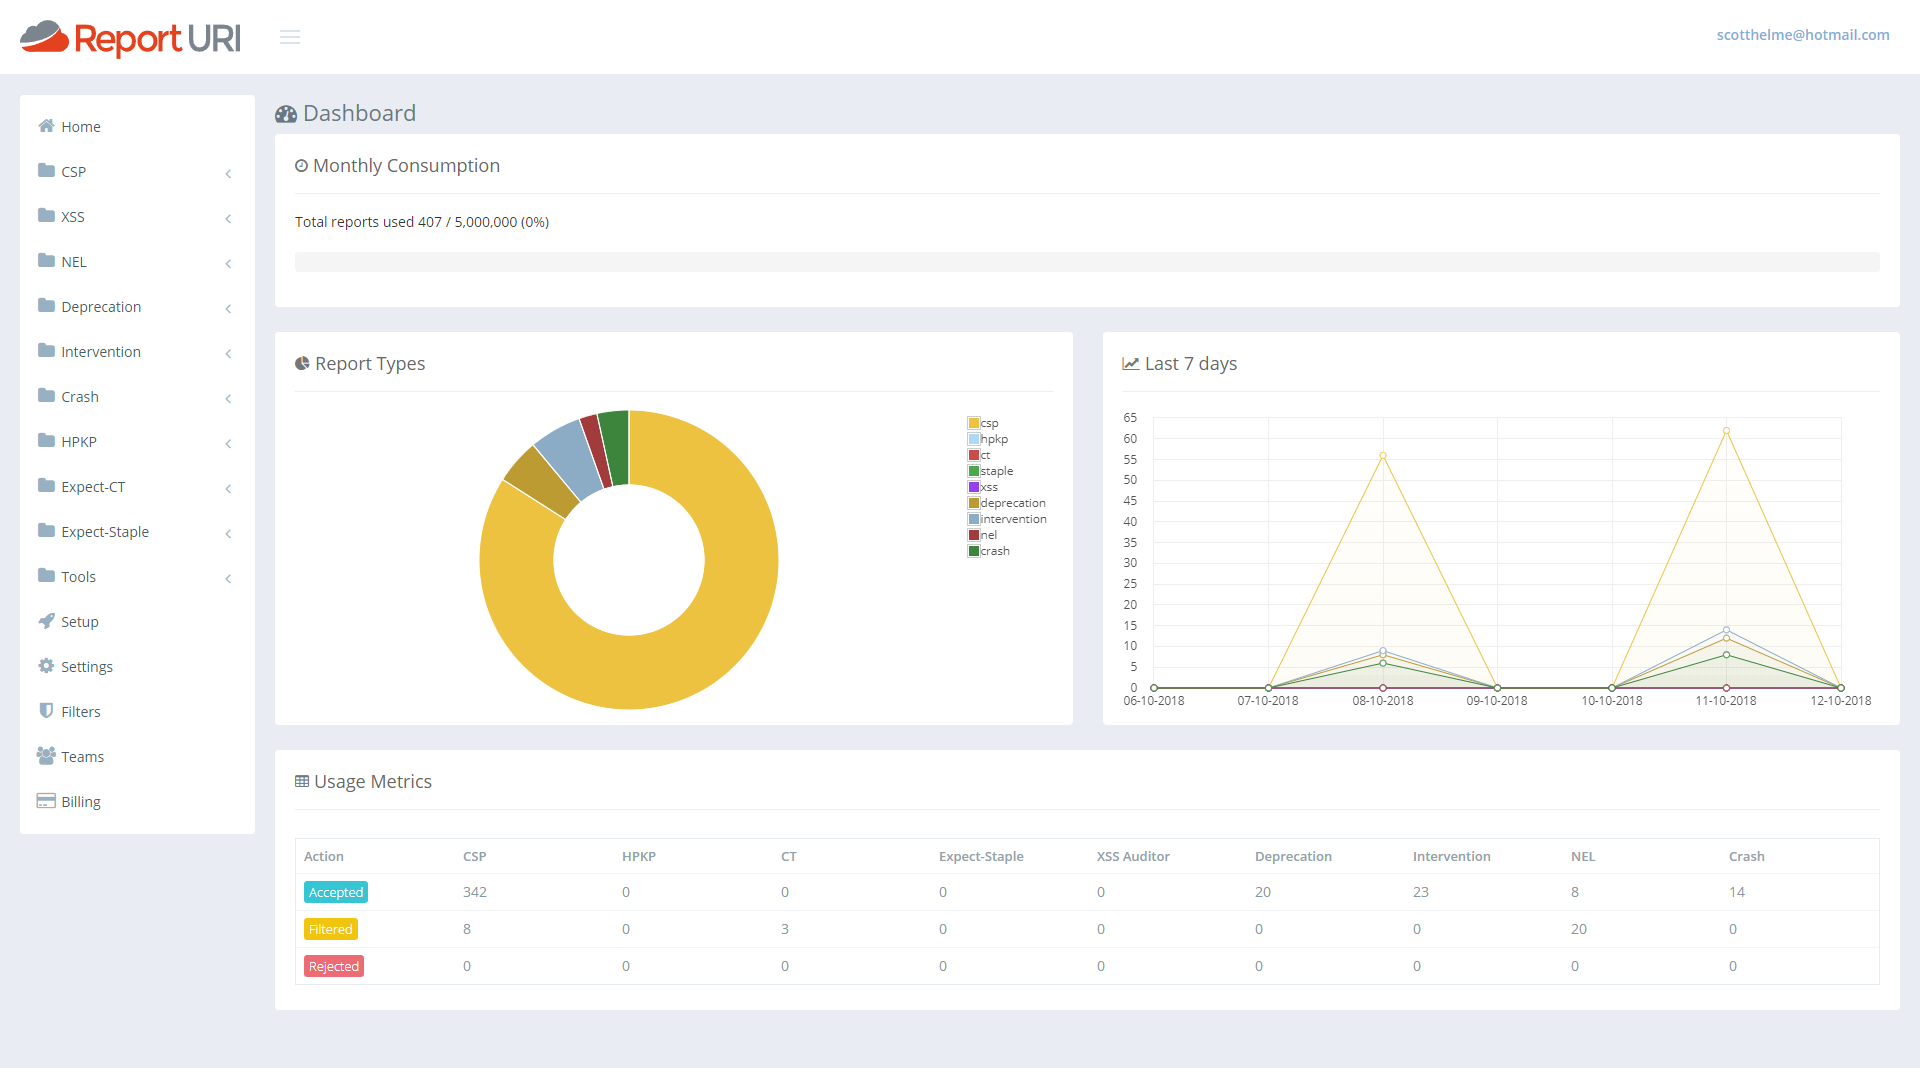
That's showing my current test data but if I switch it out to look at my production data you can get a slightly better feel.
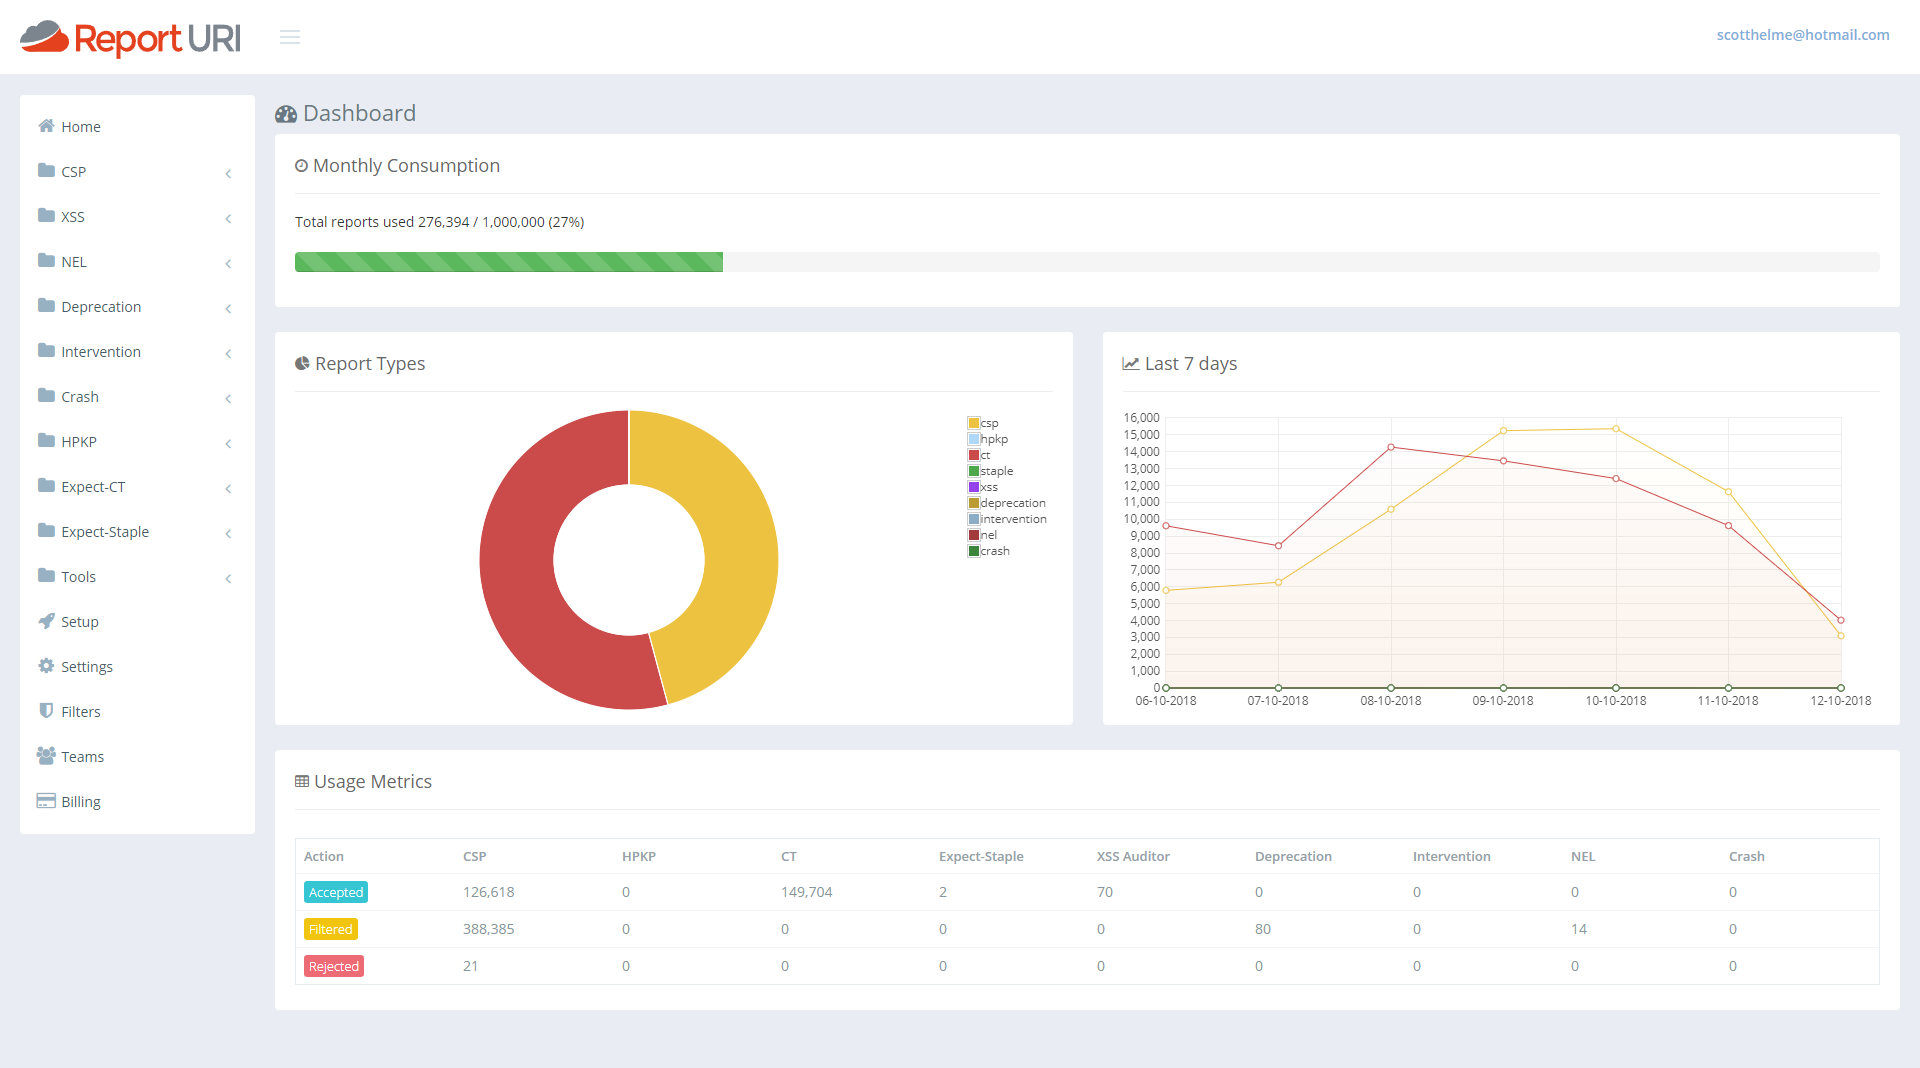
First of all we have a great new 'progress bar' across the top that will show you how much of your quota you've used at a glance. As the bar fills up it will turn yellow and then red right near the top end to warn you of any impending issues.
Under that, on the left, we then have a breakdown of what types of reports are consuming your quota. From my pie chart I can see that CSP reports are using around 45% and CT reports are using the remaining the 55% or so. Then, one addition that was actually quite hard, and I've started writing the blog on how we made this happen already, was the quick glance graph for the last 7 days of reports. With this graph you can see if any particular line has spiked over the last week and is worthy of attention and this covers all reports types. You can get an overview of everything from right here. On mine you can see my normal 'weekend dip' and then the lines for both reports return to normal levels. This should be a great addition to help catch sudden changes that you might otherwise miss.
The last addition is the new table at the bottom. This gives you the same exact numbers you have before about each report type and how many of them have been accepted, filtered or rejected, except now it doesn't take up the whole page and look awful whilst doing it!
Updated Homepage Banner
Given the much broader scope of the reports we now collect, we're stepped well outside of being a security reporting service into a much more extensive reporting service covering a broad range of areas. We can detect issues with your application code, security threats, DNS problems, TCP failures and even application errors. I felt it was worthy of a little update to show all of our capabilities off on the homepage.
Platform Detection
A small but hopefully useful change is that reports will now also indicate what platform the browser was running on when it generated the report. We're parsing this out of the UA string provided by the browser but because we don't store those with reports, we can't show this value for historic reports. It will only show on new reports received after this updated but I'm sure users will understand the reasons why.
We've seen issues in the past where a browser misbehaves in a certain way or an issue only surfaces on certain platforms so the hope is that this should ease the pain when debugging issues. Can you guess what browser and OS I use on my development PC?...
Counting Rejected Reports
Up until now you may have noticed in the old account dashboard that the counter for Rejected reports never went up. This was because of a decision we made in how to handle reports that we reject. I blogged about our use of Cloudflare Workers and how we're now running code on Cloudflare's CDN edge nodes. If a JSON payload is malformed in some way or not schema compliant, we can discard it before Cloudflare sends it to us. This made a huge difference to us because it took an enormous amount of load off our servers because the traffic simply never hit us. It did mean that we couldn't count them tough, because if the request never hits our servers, how can we count it? If we want to count it, the request, or a request, needs to be sent to our origin, and that kind of undoes the saving. We did manage to find a way to fix this though, and it has some pretty amazing implications. I will follow this article up with a technical deep dive on the wizardry we're now doing with Cloudflare Workers to make this possible, but for now we want to announce that we will now count all reports that are sent to us, including those that are rejected. Zooming in on the new account dashboards above you can see there is indeed a count of rejected reports.
One of the main things that we see this helping with is when users go over quota and don't know how many reports they would have used in a month, or what account level they need to upgrade to in order to have enough quota for all reports. Once you go over quota now you will see the Rejected reports count increasing and by the end of the month you will have a much better idea of what your overall usage would have been. A spike in this number would also indicate an issue with a client somewhere too. Perhaps they're sending malformed JSON or there are other issues with the report that mean we can't process it, but it's good to know about and track these things because it means we can take action. We as a service provider could identify a browser bug and report it to the appropriate vendor, as an example.
Future Directions
With another awesome batch of upgrades and features released with this update we're already looking to the future on what we will improve or introduce next. If you have feedback or suggestions in that regard then we're always open to listening so drop by in the comments below or hit us up on Twitter.
For me, one of the first things I want to tackle is alerting. The dashboards are looking really good but I wanted to remove the need for people to view them to keep up to speed on what's happening with their site. With some kind of basic alerting policy we could drop you an email if the current volume of reports goes x% over the last 7 days average, as an example. That means if you have a spike of reports on a given day then you could receive an email notification that something has changed and the x% would be user configurable too. Once we have the logic in place to do alerting we could then branch out more easily into other delivery mechanisms like webhooks, Slack etc...