
Continuing the trend of awesome growth, report-uri.io is now seeing more reports and users than ever before. As new technologies emerge I want to keep the ever growing user base happy and to that end I'm launching some new features and reporting.
Expanding
Although report-uri.io started out as just a CSP and HPKP reporting service, I became aware early on that the service was well suited to collect different types of data. I ingest, process and store JSON data, it's just that right now it's only JSON data about violations of a CSP or HPKP policy according to some strict formatting criteria. Because of the way I built the service from the very beginning it's really easy for me to be able to ingest any JSON data and process it differently based on a set of rules. I'm quite glad because now with the rise of Certificate Transparency and OCSP Must-Staple, there are 2 new reporting mechanisms that are going to make life a whole lot easier for site operators and help them prepare for upcoming changes.
Expect-CT and Expect-Staple
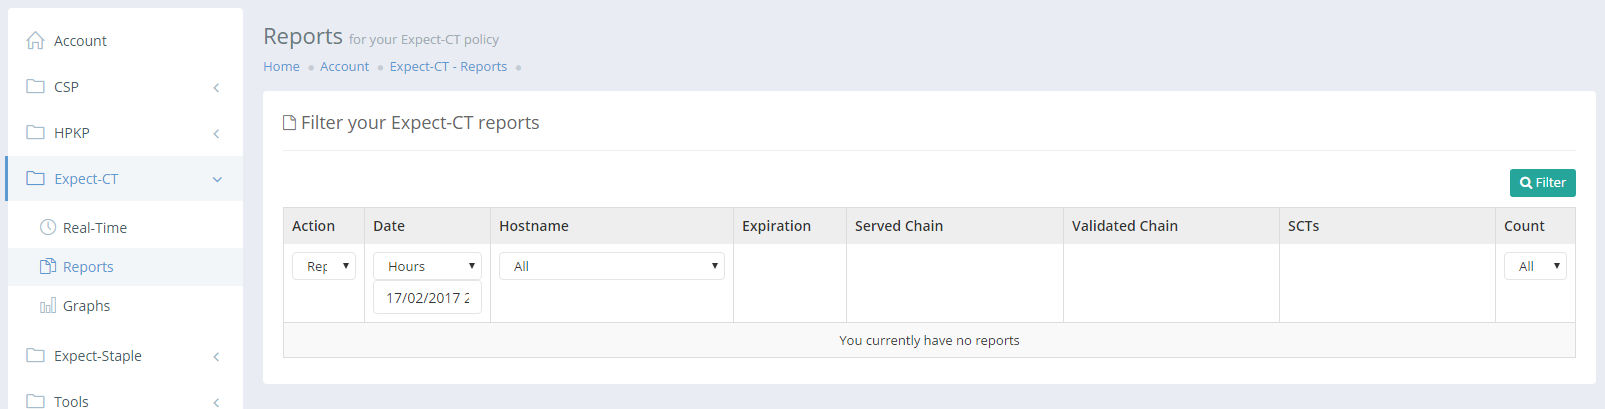
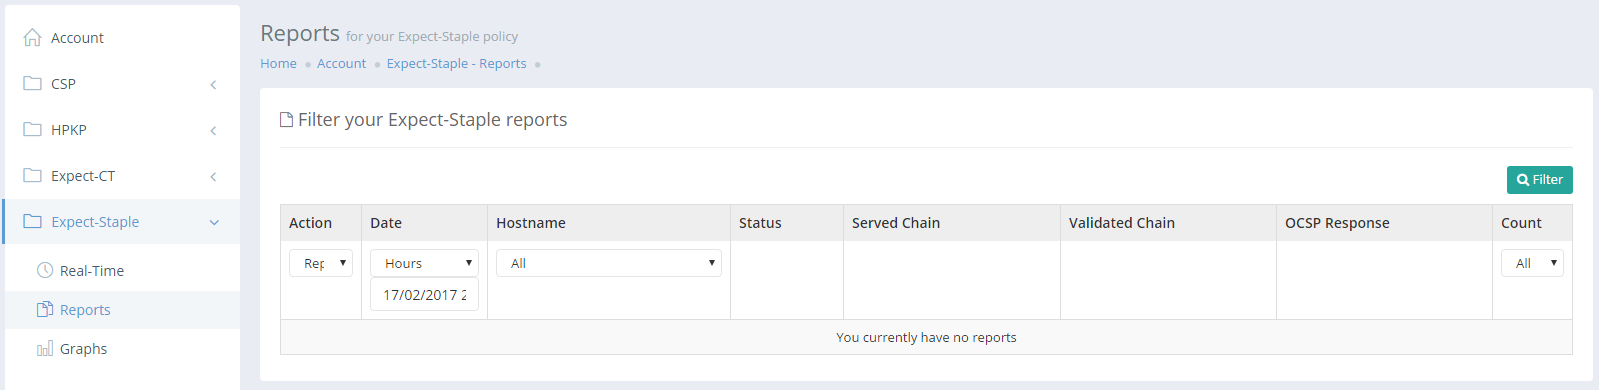
Expect-CT and Expect-Staple are two new reporting mechanisms that allow sites to monitor and get feedback on their OCSP Stapling implementation and their delivery of SCTs for Certificate Transparency. Both of these are crucial in the modern web and just like CSP/HPKP there is a reporting mechanism for the browser to let you know when things don't go as expected. I've now added support for these 2 new reports to report-uri.io and you can start collecting with us.
Just like your CSP and HPKP reporting, you get an address to use for where the browser will send your reports to.
https://scotthelme.report-uri.io/r/default/ct/reportOnly

https://scotthelme.report-uri.io/r/default/staple/reportOnly
You can then view those reports in all of the same ways that you view CSP and HPKP reports in the Account section.
Given the tight deadlines on Certificate Transparency compliance I'm hoping that reporting here will be a real help to sites getting ready and Expect-Staple is another big win for building confidence in your OCSP stapling implementation before pulling the trigger on Must-Staple. As browser support becomes more widespread these mechanisms will gain more value but even starting out with reporting just from Chrome, we've got pretty good coverage already.
Certificate Chain Analyser
One of the new tools I've introduced on the Tools page is the Certificate Chain Analyser. This will help you quickly look at a sites certificate chain and get some basic information about each of the certificates in the chain. This includes the leaf and intermediate certificates served by the server and the root certificate if it's in our trust store.
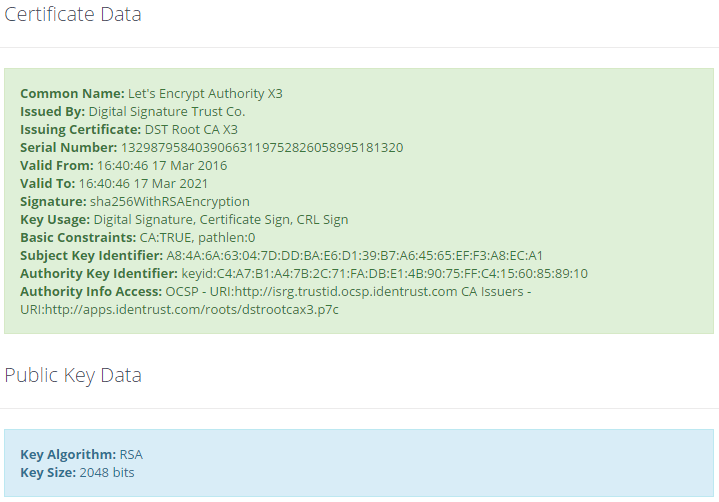
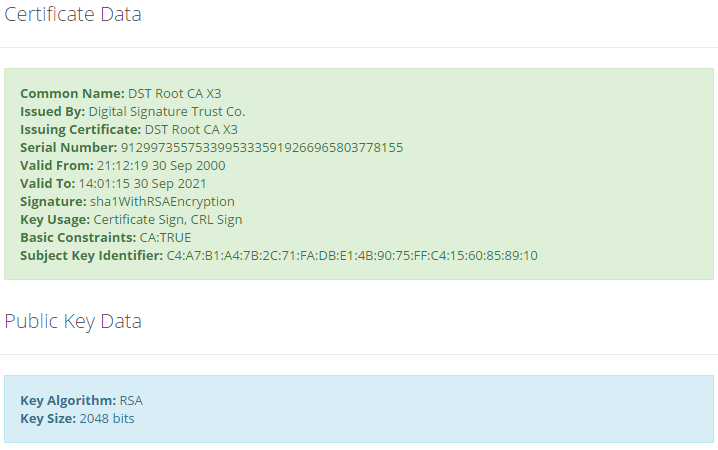
I also pretty print all of the raw output further down the page if you want to dig into things a little deeper.
PEM Decoder
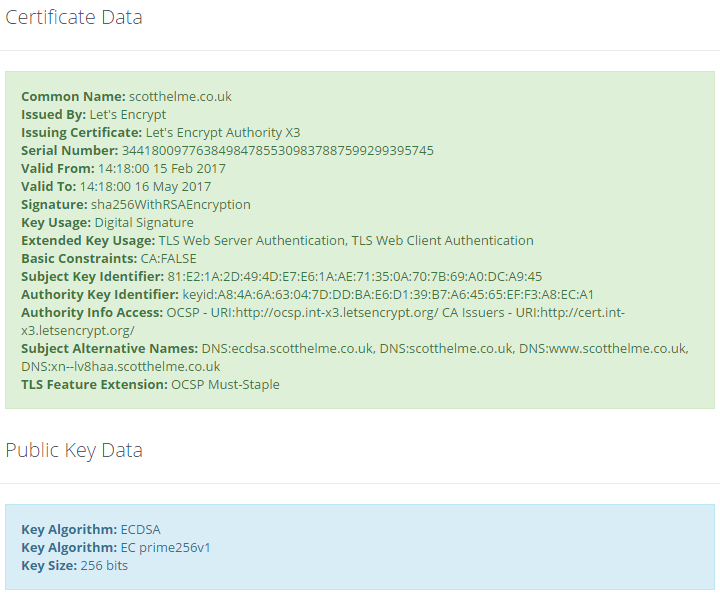
I spend a lot of time handling PEM data and that means a lot of time at the command line using OpenSSL. I wanted a nicer and easier way to quickly look at some PEM data and find out details about it. For that, I created the PEM Decoder which will allow you to paste in a PEM encoded certificate, public key or certificate signing request and get a pretty printed output.
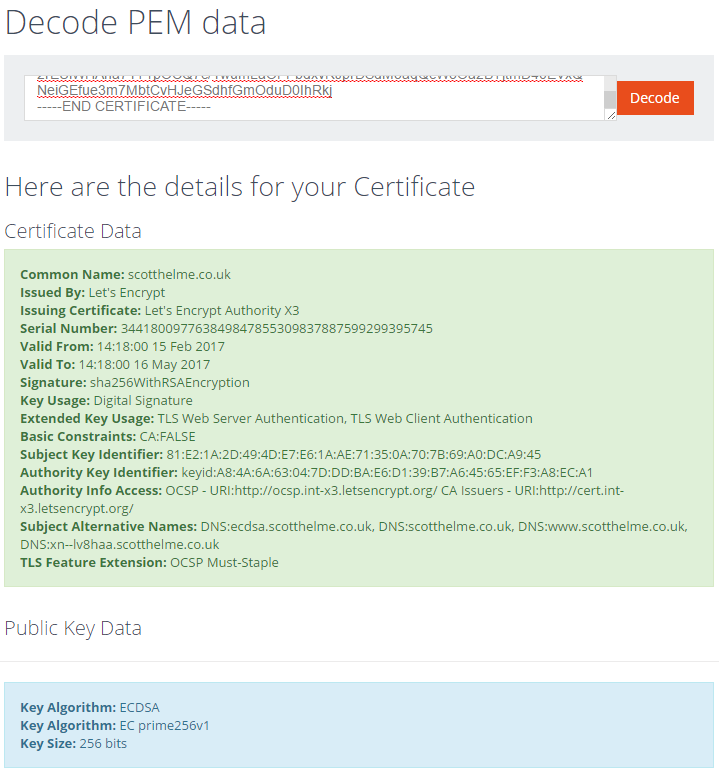
That's my ECDSA certificate being run through and the output it generates. Again, there is also a pretty printed version of the raw output further down the page for deeper analysis.
Performance and efficiency savings
As a free service I need to keep report-uri.io in top shape and working as efficiently as possible in order to keep costs down to ensure the continued operation of the service. Any opportunity to improve efficiency is always welcome and this update brings a pretty tiny change that will have a massive impact. When reports arrive at my ingestion servers, if they pass all of the checks that are applied, they are stored in five different time partitions. They are minute, hour, day, week and month. Because I use Azure Table Storage as my 'database', de-normalising the data like this massively speeds up queries for very little cost increase. This is good because the GUI is the part where people will notice bad performance so I can stop that happening and the reports are sent asynchronously in the background by the browser so no one will ever notice the slight overhead there. The only problem is I notice the slight overhead when I got to the point of handling over 2,000 reports per second! One of the most 'expensive' things I do is talk to the database so anywhere I can avoid doing that is a big win. I recently introduced memcached onto my edge servers to store filter settings for each user rather than query them out of the databases for each report and that gave me a massive performance boost. Taking the method of not talking to the databases unless absolutely essential one step further, I've introduced another change in this update. Instead of saving reports into all five time partitions, I'm now saving the reports into four time partitions (hour, day, week, month) by default and only saving into the minute partition if you're looking at the Real-Time Reports page. This means my report code went from this:
// Save a count of the report in each of the time partitions.
$this->_save_report($userId, $json, 'dmYHi', $reportType, $browser, $effectiveDirective, $reportOnly, $fullUrl['host'], $path, $blockedUrl['host'], $blockedPath);
$this->_save_report($userId, $json, 'dmYH', $reportType, $browser, $effectiveDirective, $reportOnly, $fullUrl['host'], $path, $blockedUrl['host'], $blockedPath);
$this->_save_report($userId, $json, 'dmY', $reportType, $browser, $effectiveDirective, $reportOnly, $fullUrl['host'], $path, $blockedUrl['host'], $blockedPath);
$this->_save_report($userId, $json, 'YW', $reportType, $browser, $effectiveDirective, $reportOnly, $fullUrl['host'], $path, $blockedUrl['host'], $blockedPath);
$this->_save_report($userId, $json, 'mY', $reportType, $browser, $effectiveDirective, $reportOnly, $fullUrl['host'], $path, $blockedUrl['host'], $blockedPath);
To this:
// Check to see if live reporting is enabled.
if($userEntity->getProperty('live' . $reportType) && $userEntity->getProperty('live' . $reportType)->getValue() > time())
{
    // Save the report in the minute partition if it is.
    $this->_save_report($userId, $json, 'dmYHi', $reportType, $browser, $effectiveDirective, $reportOnly, $fullUrl['host'], $path, $blockedUrl['host'], $blockedPath);
}
// Save a count of the report in each of the other partitions.
$this->_save_report($userId, $json, 'dmYH', $reportType, $browser, $effectiveDirective, $reportOnly, $fullUrl['host'], $path, $blockedUrl['host'], $blockedPath);
$this->_save_report($userId, $json, 'dmY', $reportType, $browser, $effectiveDirective, $reportOnly, $fullUrl['host'], $path, $blockedUrl['host'], $blockedPath);
$this->_save_report($userId, $json, 'YW', $reportType, $browser, $effectiveDirective, $reportOnly, $fullUrl['host'], $path, $blockedUrl['host'], $blockedPath);
$this->_save_report($userId, $json, 'mY', $reportType, $browser, $effectiveDirective, $reportOnly, $fullUrl['host'], $path, $blockedUrl['host'], $blockedPath);
When you view the Real-Time page it will now set the flag in your user entity to indicate you're viewing the page and for the ingestion servers to store reports in the minute partition. The flag is set for 120 seconds and updated every 60 seconds to ensure that while you're viewing the page the reports will always be available in the correct partition for querying. Once you stop viewing the page, the setting will expire and the servers will stop putting the reports into the minute partition saving 20% of the overhead of saving the reports in the database for the vast majority of the time. The only downside here is that when you first view the Real-Time page there can be a couple of second delay in loading the reports while the ingestion servers are updated with your new setting. Hopefully this minor impact will be understandable for the significant savings it will bring.
Software updates
Whilst making some pretty big changes I took the opportunity to update to the latest version of the CodeIgniter Framework, the PHP MVC I'm using, and also to update to the latest version of the Azure SDK for PHP. Neither of these updates brought about any significant changes but it was a good opportunity to make sure I'm using the latest and greatest. I've also installed netdata across all of the public report-uri.io servers and you can now monitor their performance in real-time if you want using my server monitoring dashboard, Horizon (blog).
More to come
Keep an eye out in the coming days and weeks because there are going to be a few more blogs about report-uri.io and things that are coming. There's some pretty awesome stuff happening right now and I'm looking forward to announcing it!