
Something that I've come to learn as we continue to grow Report URI is that everything is easy until scale makes it hard. We're now processing so much telemetry that a "one in a billion" problem can happen every, single, day, and we've had to make some significant improvements to our infrastructure to handle that whilst continuing to provide a reliable service!
Our High-Availability Redis deployment
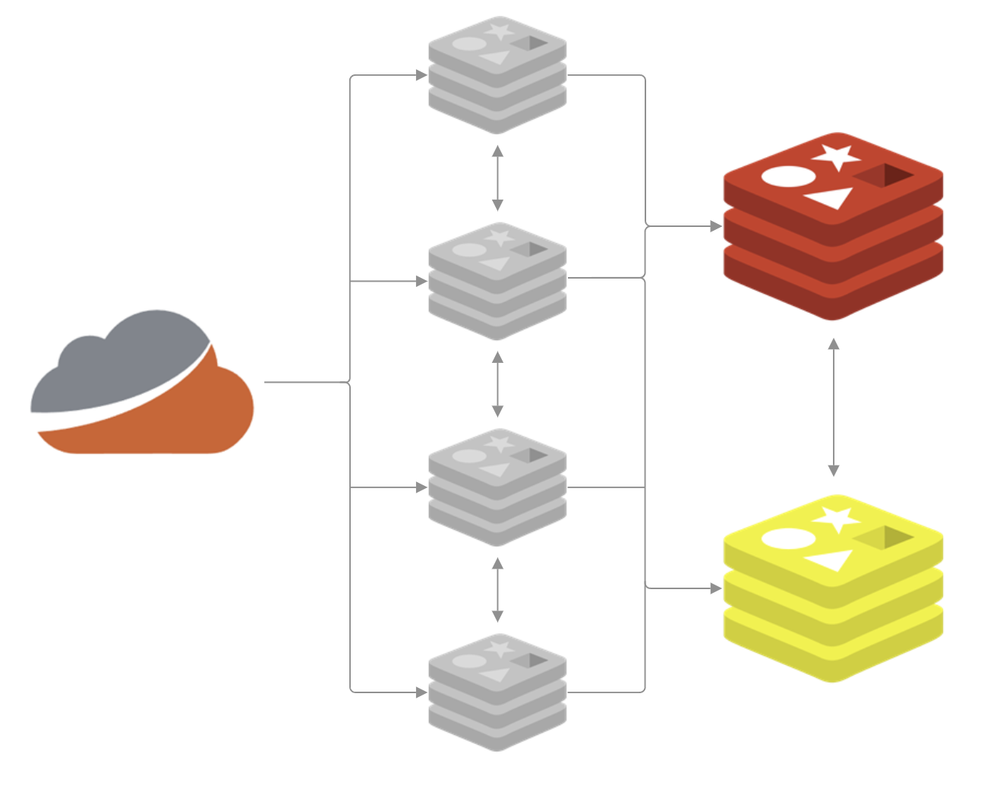
I recently wrote We're going High Availability with Redis Sentinel! and you should start there if you'd like to understand our setup with Redis and Sentinel. TLDR; we have four sentinels in front of two caches, the primary and replica, that handle our telemetry ingestion.
We moved to the HA setup to allow us more flexibility in upgrading the Redis server, changing available resources, and to add some much needed resilience, all using the failover process. All of that work has served us well and I published the linked blog post in Aug 2025, but it wasn't long before even this setup was showing the early signs of struggling. Wanting to get out ahead of any potential problems, we got to work.
Just how much are we talking?
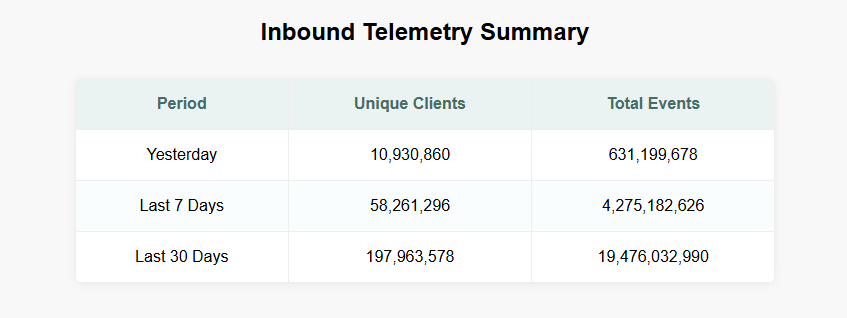
You can head over to our Global Telemetry Dashboard which is publicly available and will answer that very question. At the time of writing, this is what our summary looks like:
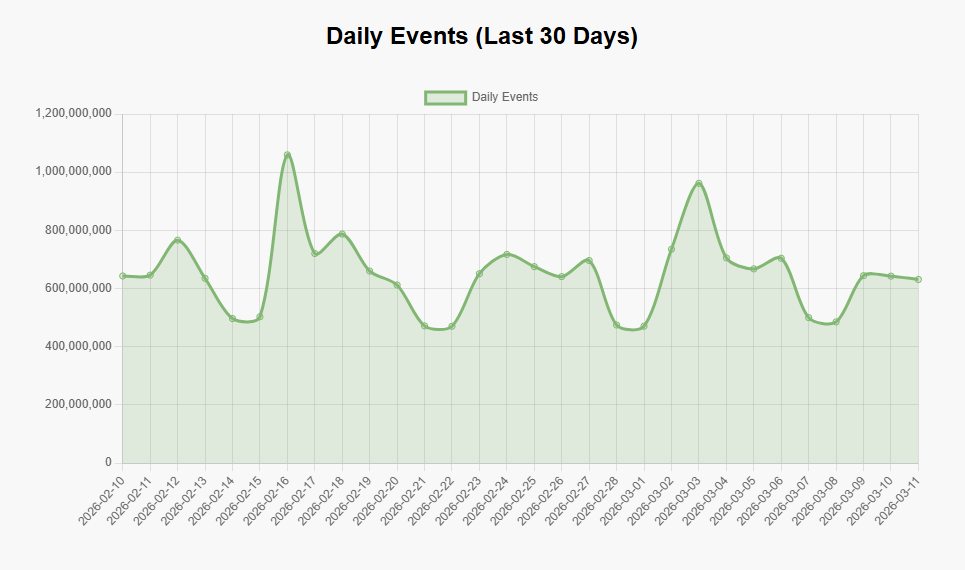
You can look at data by day, week, or even month, get technical breakdowns of the traffic like HTTP version, TLS version, client type, and more.
You can even check out our mesmerising PewPew Map to view our inbound telemetry that runs live at 5 minutes behind real-time. But, enough about how much telemetry we're processing, let's get on to the 'how'.
Identifying opportunities for improvement!
Redis is a critical part of our infrastructure and we knew that more work was needed, so we sat down and came up with a list. Internally, we refer to these tickets as 'Mega Tickets', which signifies that they're going to be a parent ticket for a bunch of other tickets, and that there's going to be a lot of work involved!
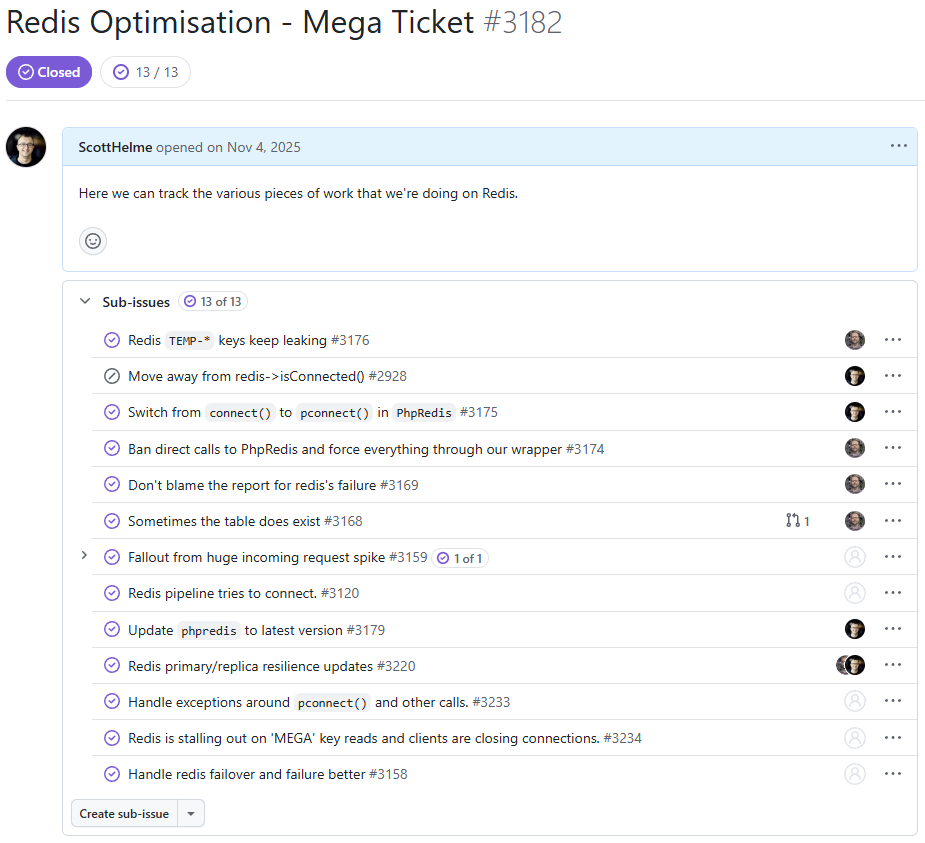
Quite of a few of these tickets were pretty interesting changes, resulting in some really big performance gains. Some of these tickets are also the kind of thing where you say "well, duh..." after you read them, but all of this was working perfectly until it wasn't. Scale creeps up on you and makes things that were previously easy much more difficult.
Optimising replication for smooth failovers
One of the main goals of introducing our High Availability setup with Redis Sentinel was so that we could gracefully failover between the primary and replica caches. This allows us to pull the primary out of use for updates, upgrades, maintenance, or if it fails and has an outage, automatically promoting the replica to the new primary to continue on. One issue that we had during failover testing was that the replica would fall a tiny fraction behind the primary on replication and when the replica was promoted to primary, rather than catching up on a small amount of data, it would instead trigger a full resync. This full sync of the dataset would hang inbound connections while processes sat around receiving the LOADING response from Redis, and occasionally the primary would get oom killed during the RDB sync. I became familiar with the copy-on-write semantic of the fork() sys call, which Redis uses for an RDB dump, during a targeted attack we were subjected to at the start of 2025. While fork() means the child process doesn't theoretically need to replicate all of the data in memory, if you have a highly volatile dataset like we do, it does! The question is, though, why is it doing a full RDB sync?!
Here's how Redis streams write commands from a primary to a replica:
                ┌─────────────────────────────────────────────┐
                │                    PRIMARY                  │
                │                                             │
                │ ┌───────────────────────────────┐           │
Writes from →   │ │   Command Stream (WRITE ops)  │           │
applications ───▶│   (SET, HSET, INCR, etc.)     │           │
                │ └──────────┬────────────────────┘           │
                │            │                                │
                │            ▼                                │
                │  ┌──────────────────────────────┐           │
                │  │   Replication Backlog (2 GB) │◄───┐      │
                │  │  Circular buffer of last N B │    │      │
                │  └──────────────────────────────┘    │      │
                │            │                         │      │
                │            │                         │      │
                │            ▼                         │      │
                │  ┌──────────────────────────────┐    │      │
                │  │ Replica Output Buffer (512MB)│────┘      │
                │  │ per connected replica client │           │
                │  └──────────────────────────────┘           │
                └─────────────────────────────────────────────┘
                                              │
                                              │ TCP stream of write commands
                                              ▼
                ┌─────────────────────────────────────────────┐
                │                    REPLICA                  │
                │                                             │
                │ ┌───────────────────────────────┐           │
                │ │   Input buffer (from primary) │           │
                │ └──────────┬────────────────────┘           │
                │            │                                │
                │            ▼                                │
                │  ┌──────────────────────────────┐           │
                │  │ Apply to dataset in memory   │           │
                │  └──────────────────────────────┘           │
                └─────────────────────────────────────────────┘
Redis only streams certain commands to the replica, those are the commands that change the dataset, so they're the only ones we need. These commands first flow into the Replication Backlog which is a circular buffer (ring buffer). Image a giant circle with the write commands being written clockwise around that circle and as the process continues, eventually you will just keep looping and overwriting yourself. The replicas are reading out of that buffer trying to keep up with the primary that is writing ahead of them. If the primary is writing faster than the replicas can read, the primary will 'overtake' the replicas and then the replicas can no longer read that data from the buffer, requiring a full re-sync from the primary instead.
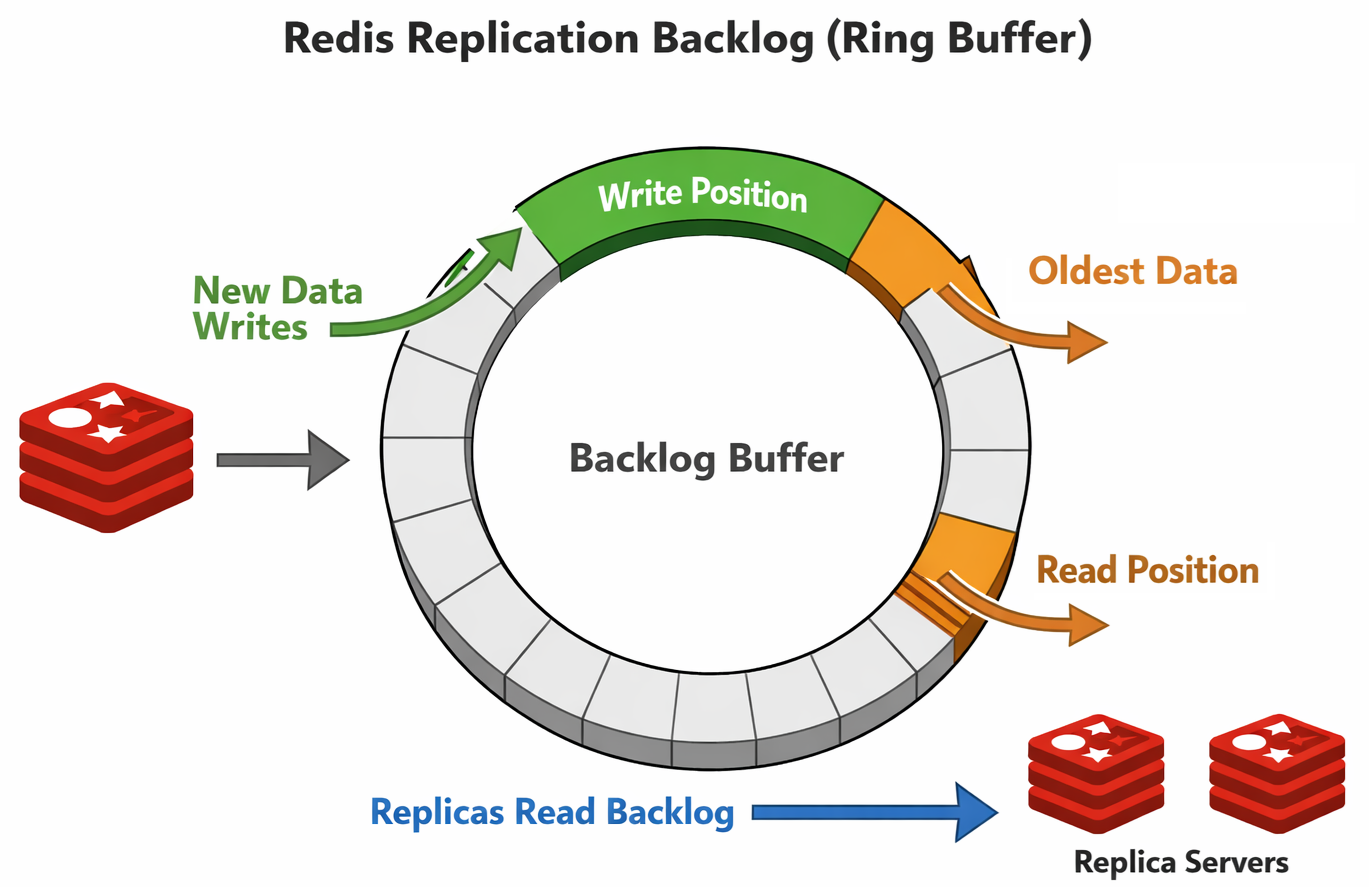
For each write that takes place in the buffer, there is an incrementing id value known as the repl_offset. A replica will keep track of the last id that it read so it can always know where it is up to in the buffer and come back for the next command, or determine if the buffer only contains commands that are too far ahead and it needs a full re-sync. Our default Replication Backlog (repl-backlog-size) was 64mb, which had been working well, but at the kind of throughputs we were now achieving on the cache, that gives us 4-5 seconds worth of history in the buffer. This means that if a replica loses contact for more than 5 seconds, when it comes back and tries to 'catch up' using the Replication Backlog, it can't, and requests a full re-sync from the primary. Increasing the memory resources on our servers and bumping the repl-backlog-size to 2GB gave us considerably more overhead and our Replication Backlog now means that a replica can be taken out of service for updates and a reboot, whilst still making it back in time to catch up using the Replication Backlog. This allows us to avoid the need for full resyncs and massively improves the efficiency of the failover process.
Persisting connections to save on overheads
Our ingestion servers can be processing thousands of telemetry events per second and after processing, the first place they land is in the Redis cache. This means that our ingestion servers, along with our sentinels and other servers, can be making thousands of connections per second to Redis. Here is a quiet time of day when we're handling almost 1,500 connections/second to Redis.
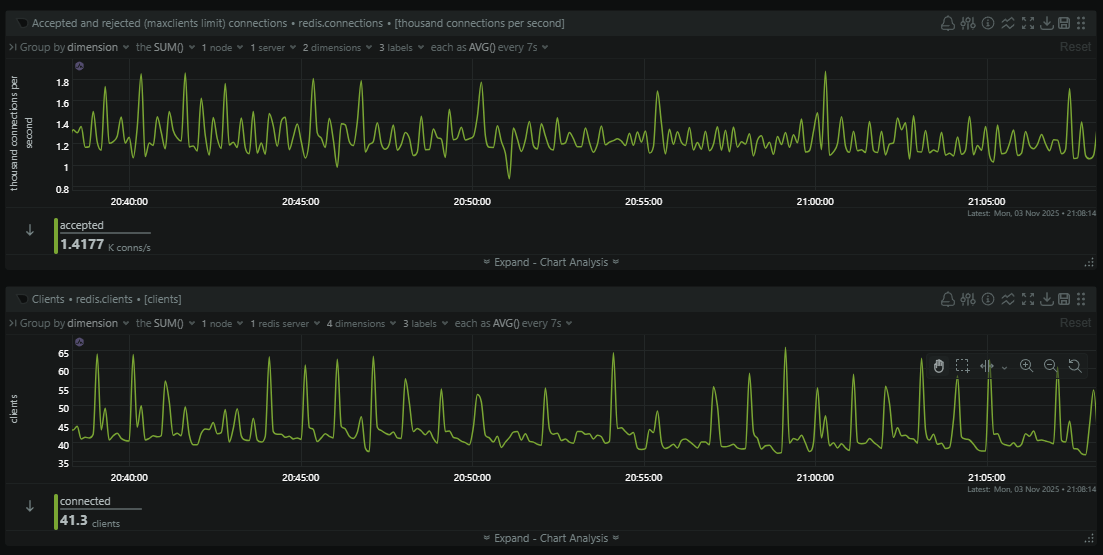
That's a lot of overhead in creating and destroying so many connections, but this is the result of using connect() in phpredis. Each connection only exists for the duration of the current request because the socket is tied to the request and will be closed when the request ends. The connection will then be fired up again in, most likely, just a few milliseconds when the next request arrives...
Switching to pconnect() seems like an obvious win here, but it does require some careful consideration. Instead of the socket being tied to the request, it would now be held by the PHP-FPM worker process, allowing for a much longer life and, importantly, re-use across many requests. This is great, because we avoid all of the overheads of setting up and tearing down the connection on each request, but, we're now going to have sockets held open for much longer, which means more connections open at any given time. This would most likely be an issue on the primary Redis server which will have connections held open from our ingestion servers, consumer servers, the sentinels, the replica, and so on. Would it be able to sustain so many long-lived connections? We ran the maths on this, allowed for a lot of error, and decided that our Redis server was capable of handling it, so we deployed the change.
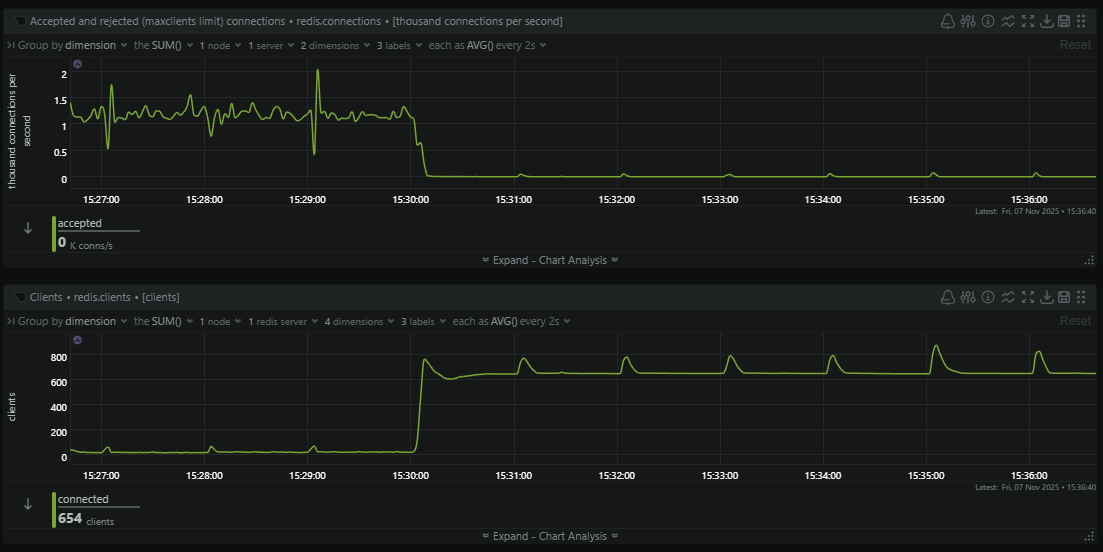
Almost immediately the number of new connections being made to Redis plummeted and the number of clients connected skyrocketed. Because a typical PHP-FPM worker can process 3,600 inbound requests (pm.max_requests = 3600) we're saving 3,599 connections to Redis for every 3,600 inbound telemetry events that we process, which is quite the significant saving! This also reduced the processing time of each request on our ingestion servers because the Redis connection is most likely already setup and waiting, so we're saving that overhead on each request too. The final consideration was then that a process could connect to the primary, and a failover could happen after the connection was established, meaning you're now connected to the replica. In this case you will get a READONLY exception if you try to write or change data and simply need to hit the Sentinels again to reconnect to the new primary and retry the same request again.
Avoiding large reads that take too long
As Redis is single-threaded, at least on the main command processing pathway, having any single operation that keeps that thread busy for prolonged periods of time is a Very Bad Idea (TM). Our Sentinels will determine if the primary Redis cache is available by sending requests and waiting for an answer, but if you can keep Redis busy for too long, the Sentinels can determine it's not available and trigger a failover. We saw some failovers that seemed to have no explanation in terms of the cache being unavailable, yet they happened anyway. In the end we turned to SLOWLOG to see if we could explain what might make Redis look like it wasn't available, and we found the culprit.
In our telemetry processing pipeline, all events pass through Redis and are gathered in a hash, ready for a consumer to come along and pull a batch of events to process them into the database (Azure Table Storage). To do this, these consumer servers will call hGetAll() to grab the content of the hash and then delete it from Redis, and this is where things were going wrong.
 1) 1) (integer) 6436
    2) (integer) 1762833603
    3) (integer) 1049238
    4) 1) "HGETALL"
       2) "TEMP-WIZARD-1969791144"
    5) "snip:34018"
    6) ""
 2) 1) (integer) 6435
    2) (integer) 1762833423
    3) (integer) 1005244
    4) 1) "HGETALL"
       2) "TEMP-WIZARD-533592971"
    5) "snip:54284"
    6) ""
 3) 1) (integer) 6434
    2) (integer) 1762833063
    3) (integer) 1072218
    4) 1) "HGETALL"
       2) "TEMP-WIZARD-383568749"
    5) "snip:47118"
    6) ""
 4) 1) (integer) 6433
    2) (integer) 1762833003
    3) (integer) 1073379
    4) 1) "HGETALL"
       2) "TEMP-WIZARD-1518767320"
    5) "snip:36282"
    6) ""
 5) 1) (integer) 6432
    2) (integer) 1762832822
    3) (integer) 1002085
    4) 1) "HGETALL"
       2) "TEMP-WIZARD-367184566"
    5) "snip:60828"
    6) ""
There's a hGetAll() call in there that took 1,073,379μs, which is almost 1.1 seconds, to complete! These SLOWLOG entries were also taken during a relatively quiet period for us and, given our consumer servers pull on a regular cadence, a high volume of inbound telemetry would mean more data to fetch in the hGetAll() and a longer time to complete as a result.
To remove this long blocking call we migrated from hGetAll() to hScan() instead, and using a Generator in PHP we can now progressively read back the content of the hash allowing for other commands to run between hScan() calls. We're currently capping the length of a hScan() call to ~500,000μs (500ms) so that we're never keeping the main process busy for too long.
 1) 1) (integer) 5957
    2) (integer) 1763047503
    3) (integer) 599277
    4) 1) "HSCAN"
       2) "TEMP-MEGA-775261748"
       3) "0"
       4) "COUNT"
       5) "100000"
    5) "snip:52516"
    6) ""
 2) 1) (integer) 5956
    2) (integer) 1763047382
    3) (integer) 575907
    4) 1) "HSCAN"
       2) "TEMP-MEGA-991577969"
       3) "0"
       4) "COUNT"
       5) "100000"
    5) "snip:42706"
    6) ""
 3) 1) (integer) 5955
    2) (integer) 1763047321
    3) (integer) 546641
    4) 1) "HSCAN"
       2) "TEMP-MEGA-1663792648"
       3) "0"
       4) "COUNT"
       5) "100000"
    5) "snip:39818"
    6) ""
 4) 1) (integer) 5954
    2) (integer) 1763047262
    3) (integer) 563350
    4) 1) "HSCAN"
       2) "TEMP-MEGA-903905420"
       3) "0"
       4) "COUNT"
       5) "100000"
    5) "snip:50746"
    6) ""
 5) 1) (integer) 5953
    2) (integer) 1763047201
    3) (integer) 609534
    4) 1) "HSCAN"
       2) "TEMP-MEGA-1690091359"
       3) "0"
       4) "COUNT"
       5) "100000"
    5) "snip:49308"
    6) ""
This also made our Redis resource graphs much more smooth by removing some of the huge peaks caused by these reads and also stopped other clients stalling out for brief periods when the main thread was busy. Overall, a nice improvement.
Add more cloud
You can solve a lot of problems by throwing more money at them, but we tend to hold out and only use this as a last resort when it's the proper solution to a problem. The Redis caches that handle our inbound telemetry are doing a lot of work for us, and despite all of our optimisations, we arrived at the conclusion that they needed more resources. The Sentinel servers have been doing awesome and will probably be able to cope for the foreseeable future, especially after the pconnect() upgrade significantly reduced the load on them, but our main caches did get an upgrade.
redis-report-cache-primary
in Report URI / 16 GB Memory / 4 Intel vCPUs / 160 GB Disk / SFO2 - Ubuntu 24.04 (LTS) x64
tags: redis-report

redis-report-cache-replica
in Report URI / 16 GB Memory / 4 Intel vCPUs / 160 GB Disk / SFO2 - Ubuntu 24.04 (LTS) x64
tags: redis-report

redis-report-cache-sentinel-01
in Report URI / 2 GB Memory / 60 GB Disk / SFO2 - Ubuntu 24.04 (LTS) x64
tags: redis-report

redis-report-cache-sentinel-02
in Report URI / 2 GB Memory / 60 GB Disk / SFO2 - Ubuntu 24.04 (LTS) x64
tags: redis-report

redis-report-cache-sentinel-03
in Report URI / 2 GB Memory / 60 GB Disk / SFO2 - Ubuntu 24.04 (LTS) x64
tags: redis-report

redis-report-cache-sentinel-04
in Report URI / 2 GB Memory / 60 GB Disk / SFO2 - Ubuntu 24.04 (LTS) x64
tags: redis-report
Thanks to the High Availability deployment with Sentinel, this was a simple case of pulling the replica down, upgrading the server, and bringing it back online. Once the replica had fully caught up, we triggered a failover so the upgraded replica became the primary, and then we could pull down the other server which was now acting as the replica for its upgrades. Nice and easy! This upgrade didn't add a huge amount of cost, but it has added a huge amount of headroom when it comes to the capability of the servers, giving us some breathing room well into the future.
Future ideas
We've considering pushing read traffic against the Redis replica before now, but there are a few scenarios where this isn't going to work particularly well for us. The main problem is that we have a volatile dataset of inbound telemetry that is undergoing significant write velocity, so reading from that needs to be done carefully. We also use Redis for various atomic write-locks in several code paths so we need the read-after-write consistency that we'd lose during the sync to the replica. For now, our optimisations seem to be providing significant benefits and our infrastructure looks like it can handle a lot more before we need to consider further changes or upgrades. If you have any other suggestions on how can improve or anything worth tweaking that might help us, please feel free to drop them in the comments below!