
I recently gave a brand new talk at NDC Oslo about how we scaled Report URI from 10,000 reports per month to 10,000 per second! The talk was well received and got great feedback with some good questions in the Q&A too. I wanted to answer something that many of the questions were geared towards, just what are the numbers for a typical week at Report URI?
![]()
Report URI
I'm sure everyone here knows about Report URI, the real-time security reporting service I setup a little over 3 years ago now. It's come an awful long way in those 3 years and right now we're currently processing 2,000,000x more reports per month than we were back then! That's a pretty big increase (yes it really does say 2,000,000x) and we've gone through a lot of changes since then. We had a serious overhall and re-brand and announced Troy Hunt was coming on board as an investor too. We've overcome countless challenges including redirects, the EU, new features, hacking Azure Table Storage (twice), launched our own JS library, XSS Auditor Reporting, the CSP Wizard and won an amazing award, The Best Emerging Technology of 2018!!! (holy crap that was a long list and there was a lot more too 1 2 3)
What I want to do though is show you, in numbers (and pretty graphs) what an average week looks like at Report URI. To get started, a quick guide of our infrastructure, just so you can understand where each of the graphs is coming from.
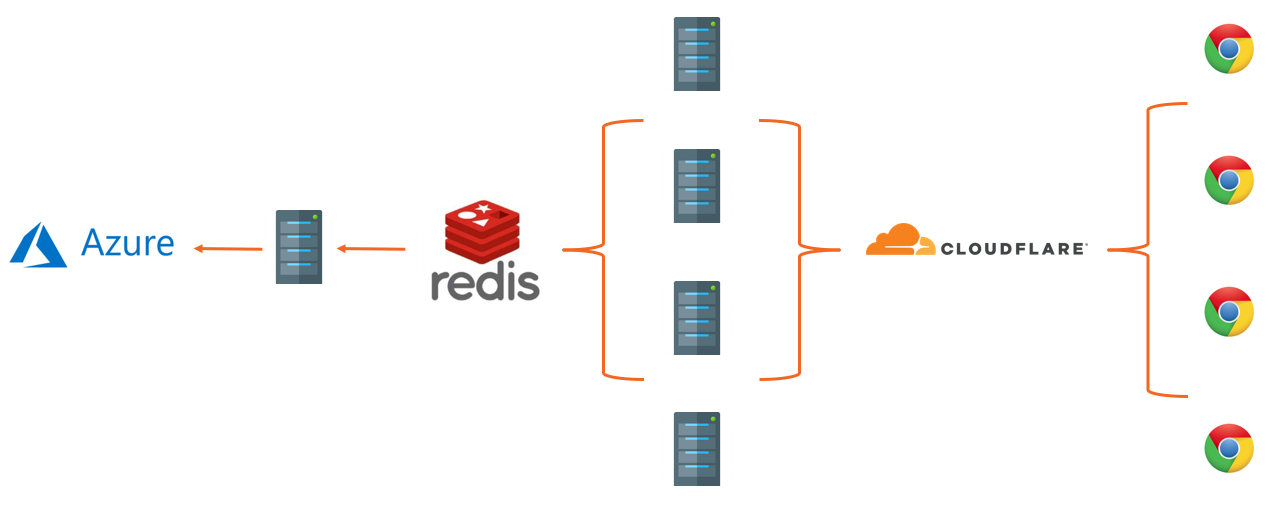
The browser sends us reports which first hit our CDN, Cloudflare. Cloudflare does some basic processing for us like JSON validation, filtering bad payloads and traffic and then forwards the reports to our servers in Digital Ocean. Those servers do much more filtering using our advanced filter sets that we build by analsying huge volumes of traffic, they are also filtered based on custom filters set by our users and then stacked in our local Redis server. Reports are stacked in Redis for 10 seconds so we can massively de-duplicate them and then a consumer pulls the whole contents of the Redis cache and stores them in our 'database', Azure Table Storage. Table Storage is a cloud scale NoSQL key-value store that we use for storing and querying out all of the reports for our customers and inserting into Table Storage in batches is a lot more efficient, in both cost and performance, which is why we stack in Redis first. Now that you have a (very) brief intro to our infrastructure, onto the numbers! These are for the week Mon 25th June to Sun 1st July.
Cloudflare
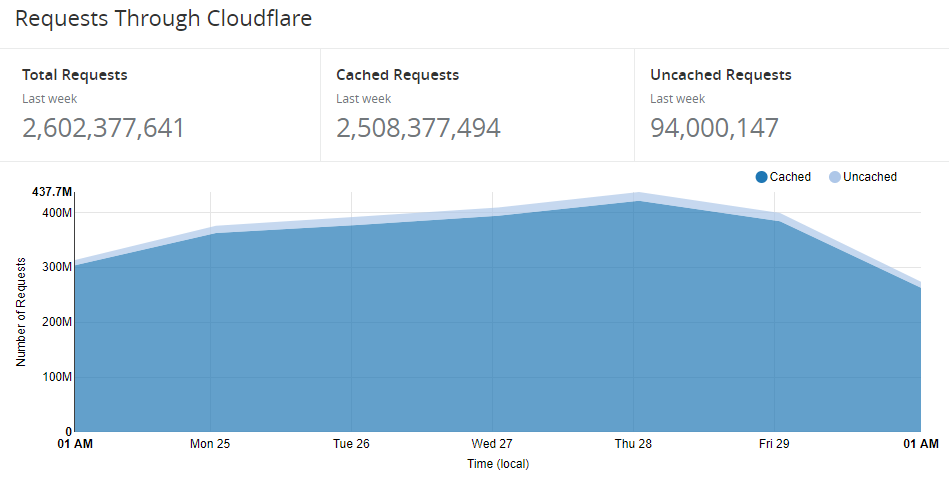
Given that reports hit Cloudflare first it seems logical to start there. This week we did 2,602,377,621 reports so far!
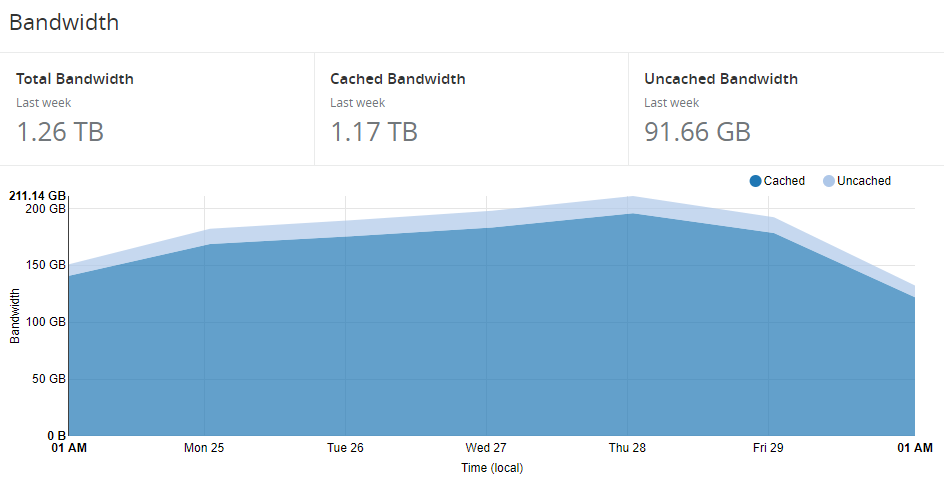
That chewed through 1.26 TB of bandwidth.
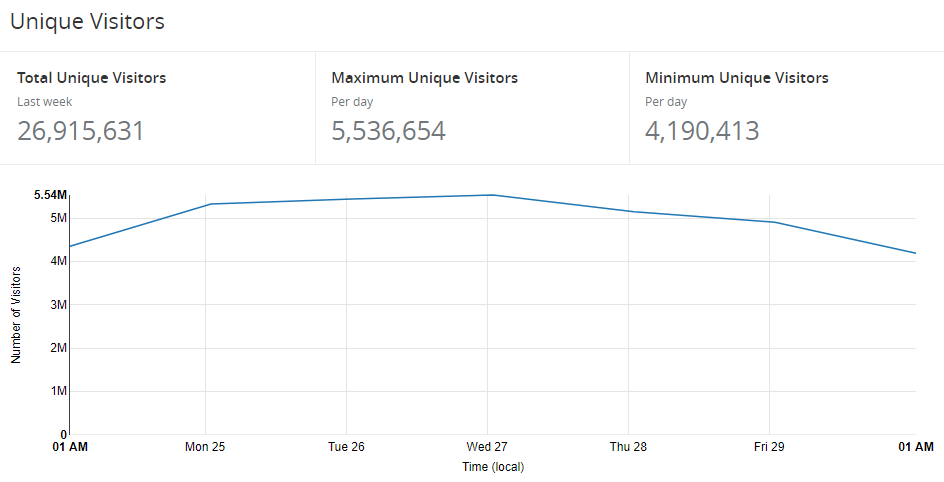
We also see an awful lot of unique visitors dispatching reports to us.
As you can see, Cloudflare are dealing with the vast majority of our inbound traffic and only a small portion is being forwarded to our origin. We can see why that is if we look at the status codes.
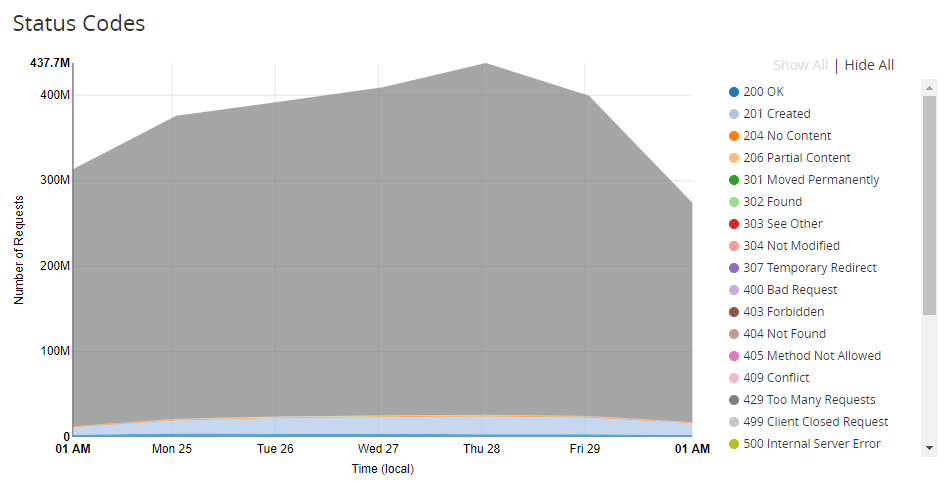
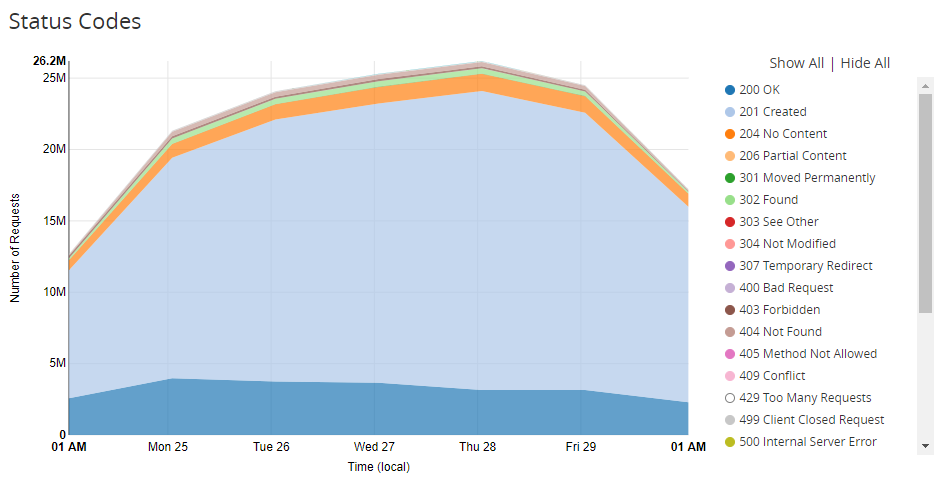
The graph is a little overshadowed by the huge portion of the responses being a 429 status code, Too Many Requests. Once one of our customers exceeds their monthly quota of reports, we get Cloudflare to stop sending us their reports, so they never actually hit our servers. If we remove the 429 status code from that graph you can see the rest of the status code are healthy.
To do this 'smart' handling of traffic based on whether one of our customers is over quota, we're using Cloudflare Workers which I talked about back in April. We execute code on Cloudflare's edge and with that we can do any custom processing we like.
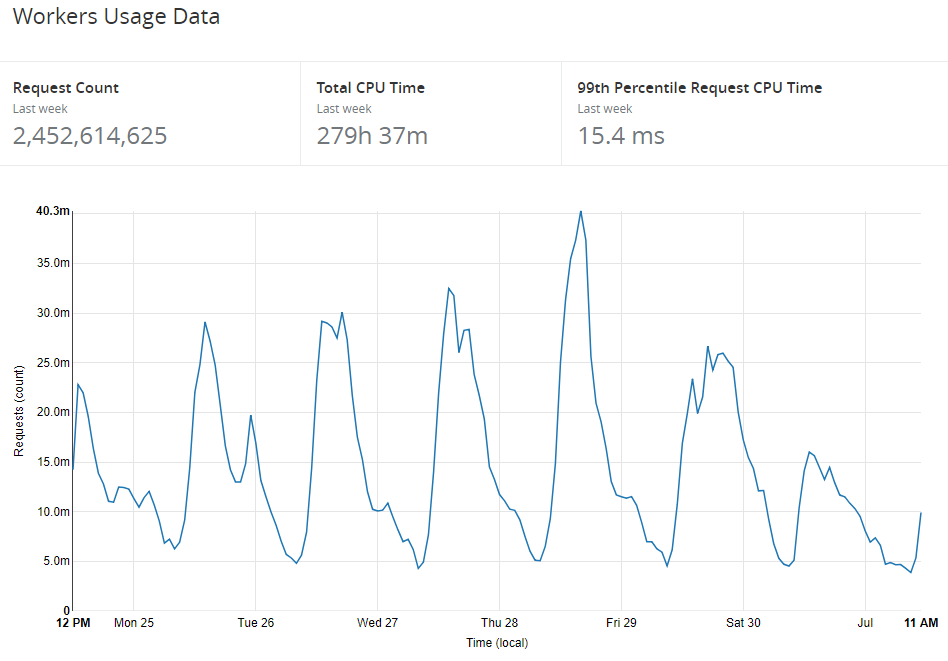
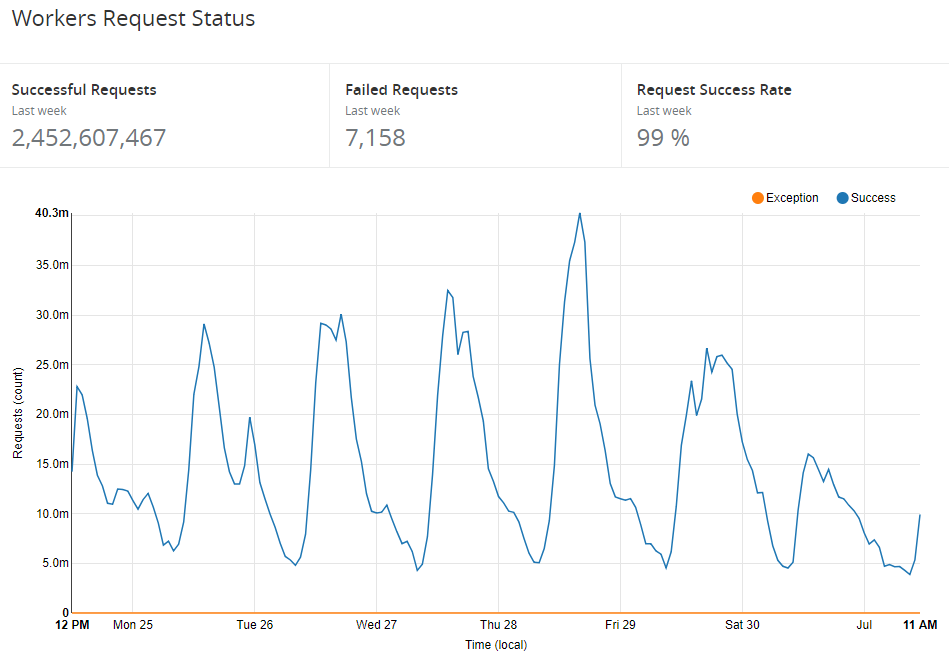
Workers are very powerful and also very reliable.
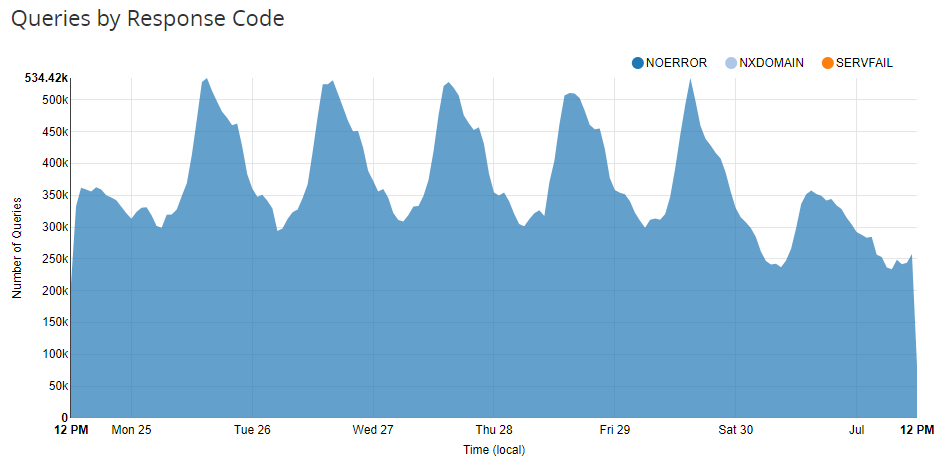
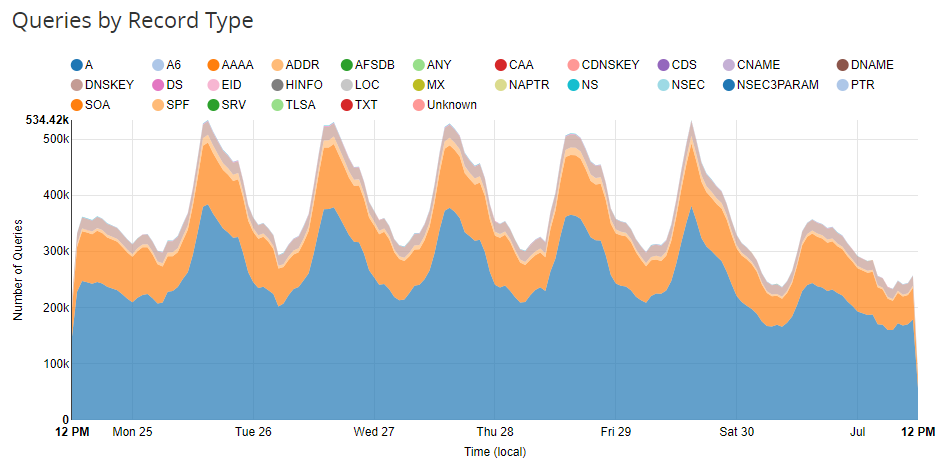
Prior to inbound requests actually happening we also had DNS, which Cloudflare also takes care of for us. We have a pretty big volume there too.
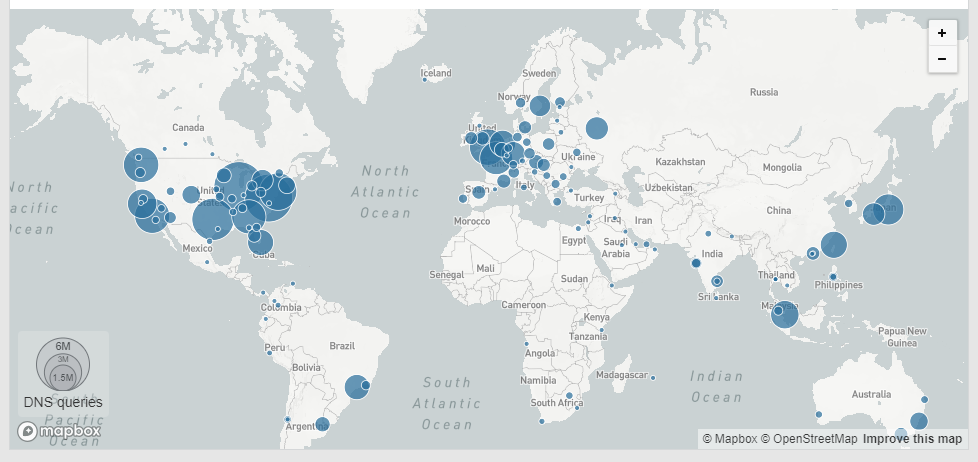
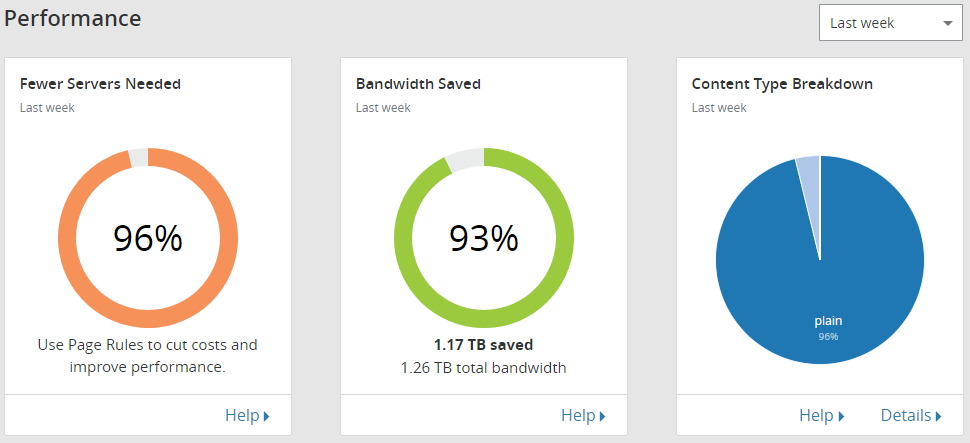
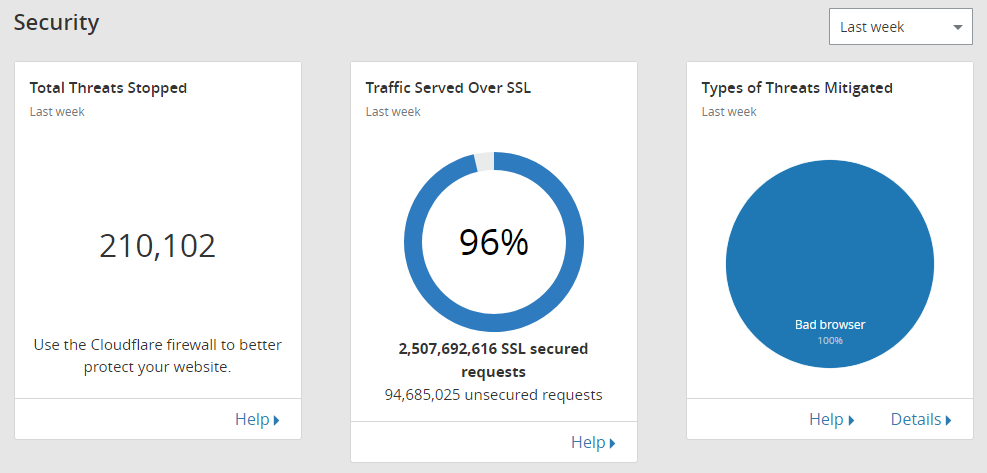
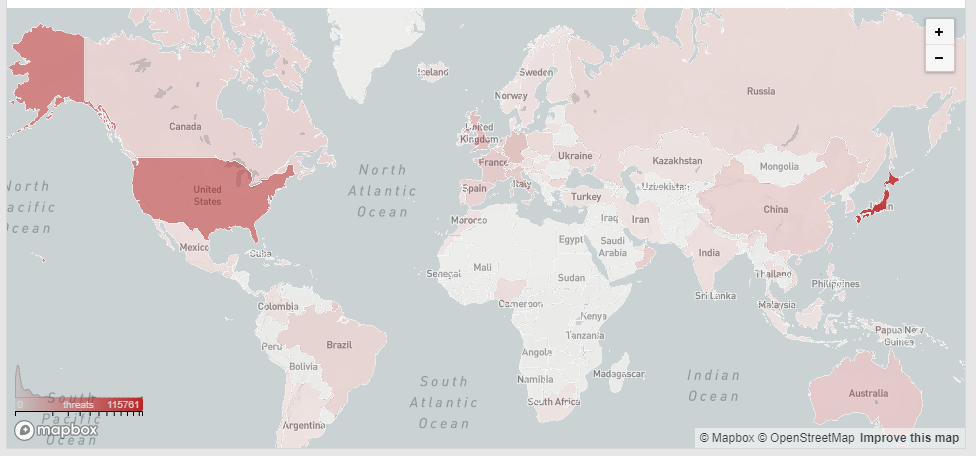
Finally, Cloudflare give us some nice Performance and Security statistics and show us a threat map of where we see most of our problems coming from.
Digital Ocean
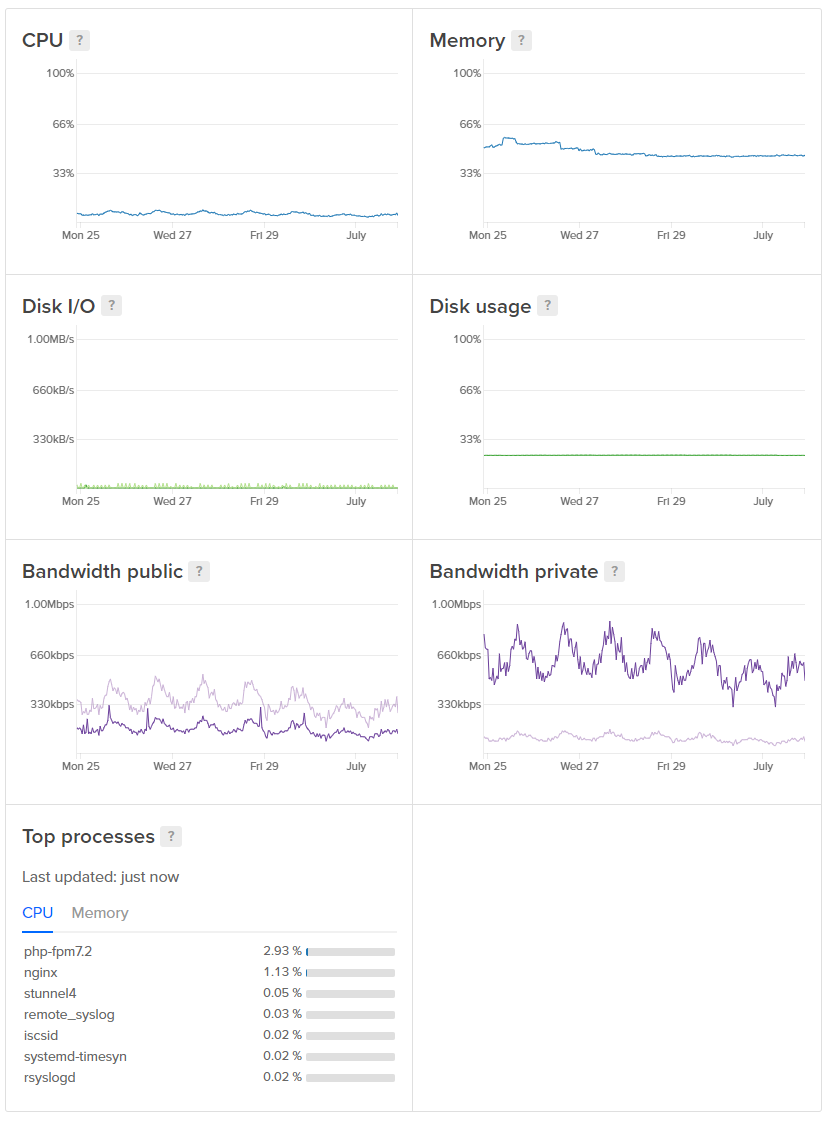
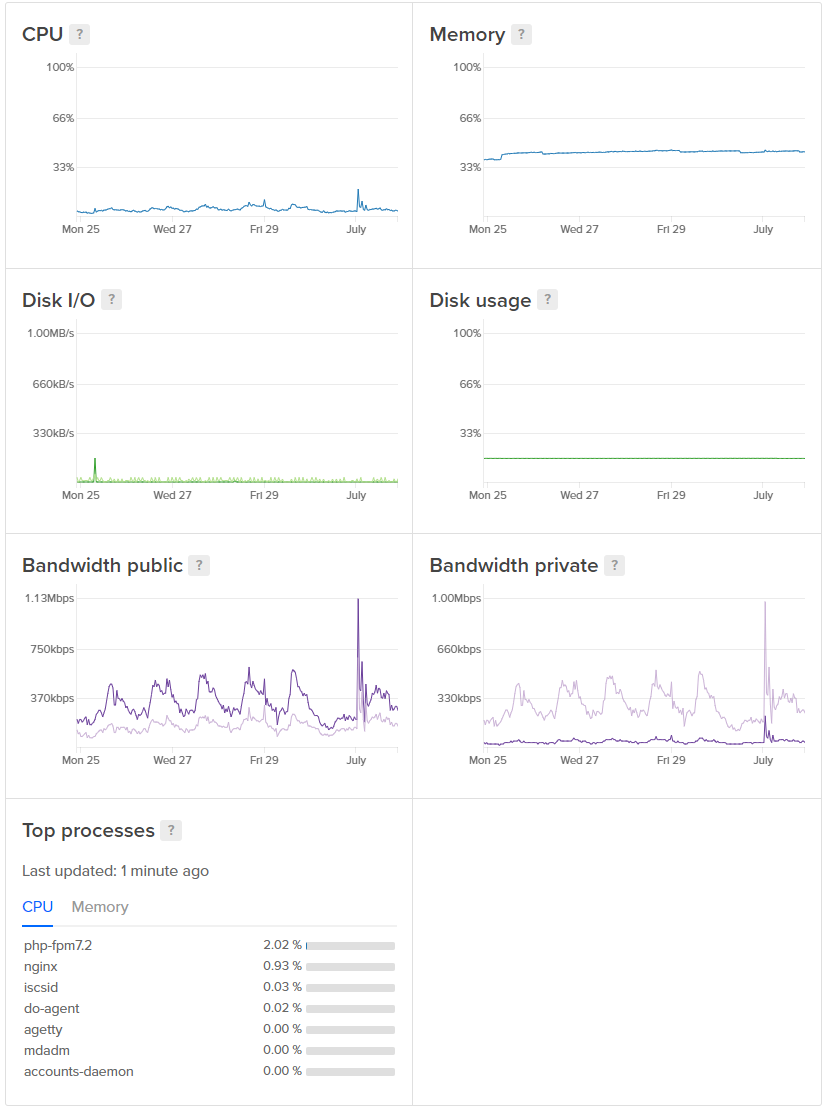
Once Cloudflare has done their processing the reports are then sent through to us along with genuine web traffic. After we got hit with a massive, accidental DDoS a couple of years back we segregated our web infrastructure from the report ingestion infrastructure. If we got hit with such an enormous flood of reports again it might affect our ability to ingest reports, and we could potentially lose some, but it wouldn't impact the website which would still be working just fine. Our web servers are generally cruising along at a pretty relaxed pace, here's a snapshot from one of them.
We also have a dedicated Redis instance just for session storage for the same reason as above, to keep everything isolated. We used to use Table Storage as our session store but we keep it local now.
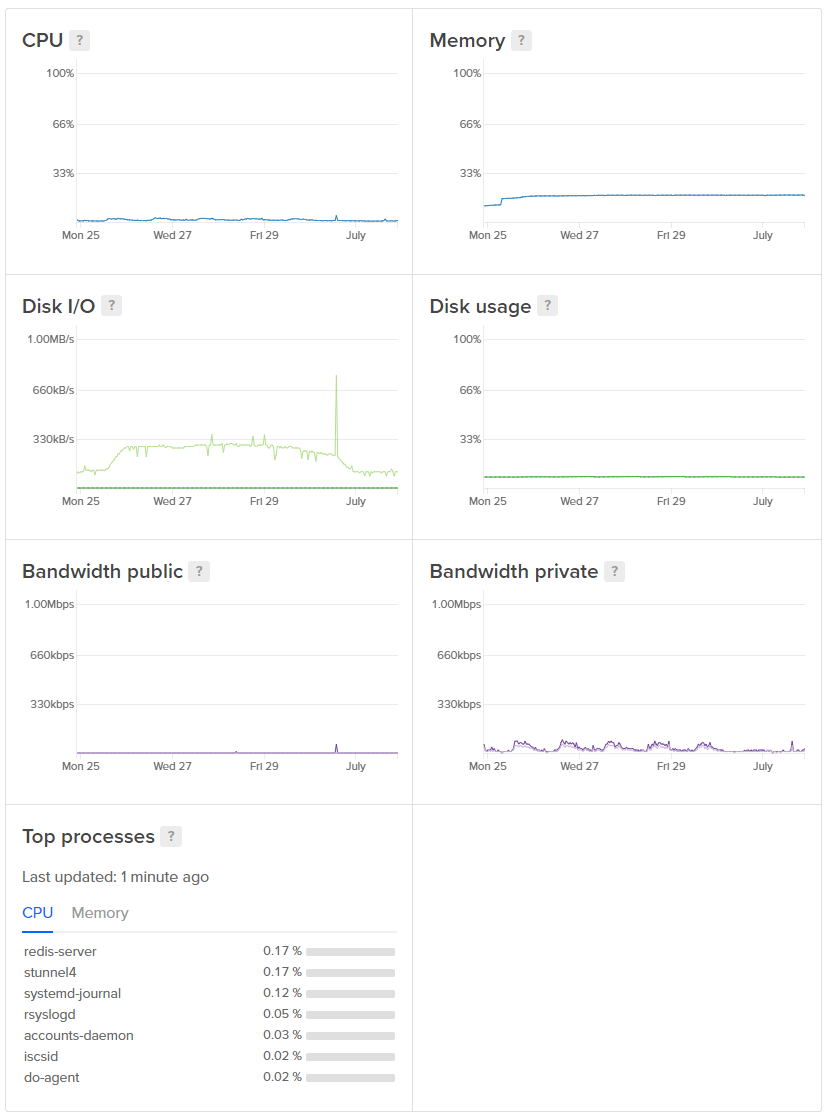
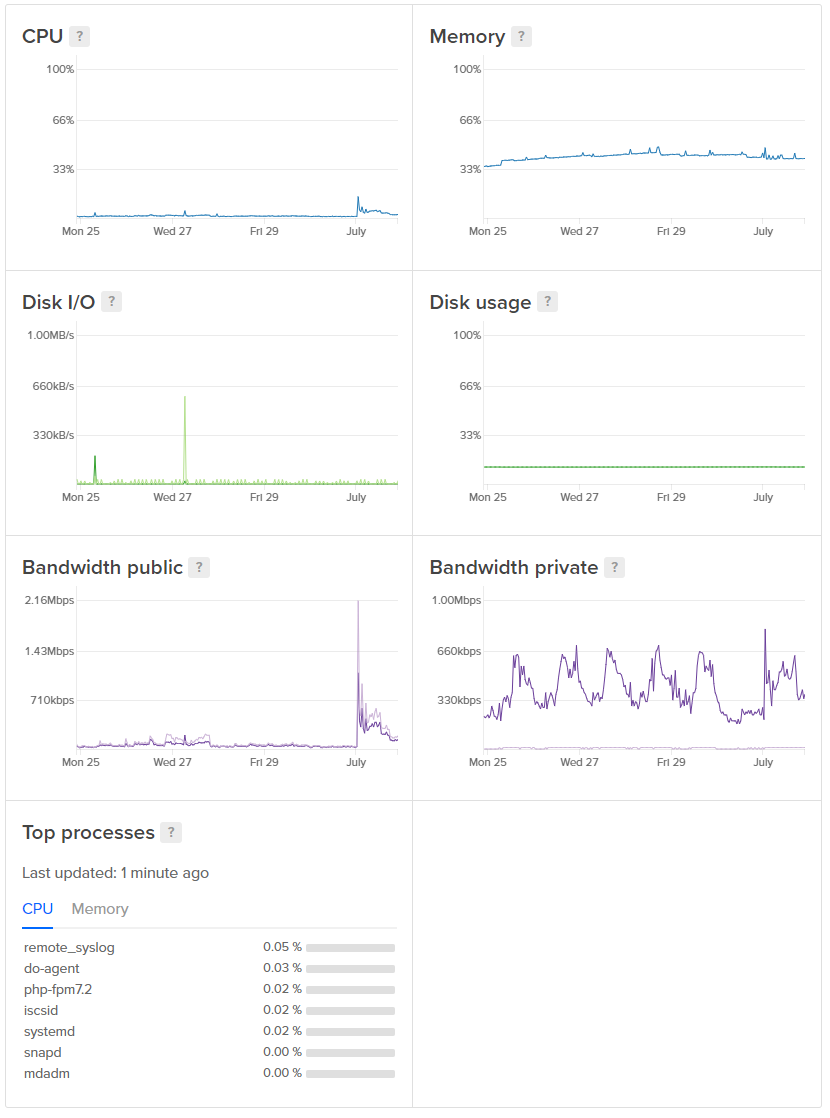
After the web servers and session store we have the report ingestion servers. These are the servers that receive the reports from Cloudflare and do the bulk of the work so we have a nice selection of these too. We keep them averaging pretty low on resources because reporting is a very spiky business and you can see the monthly roll over in the graphs when all of our customers get their new quota. We also get similar events when new customers come on board too. That can happen at any time and without notice.
The ingestion servers do all of their processing, filtering and normalising before placing the reports into the report Redis cache. This thing is a beast as it handles a seriously large amount of reports coming in and the consumers feeding of it.
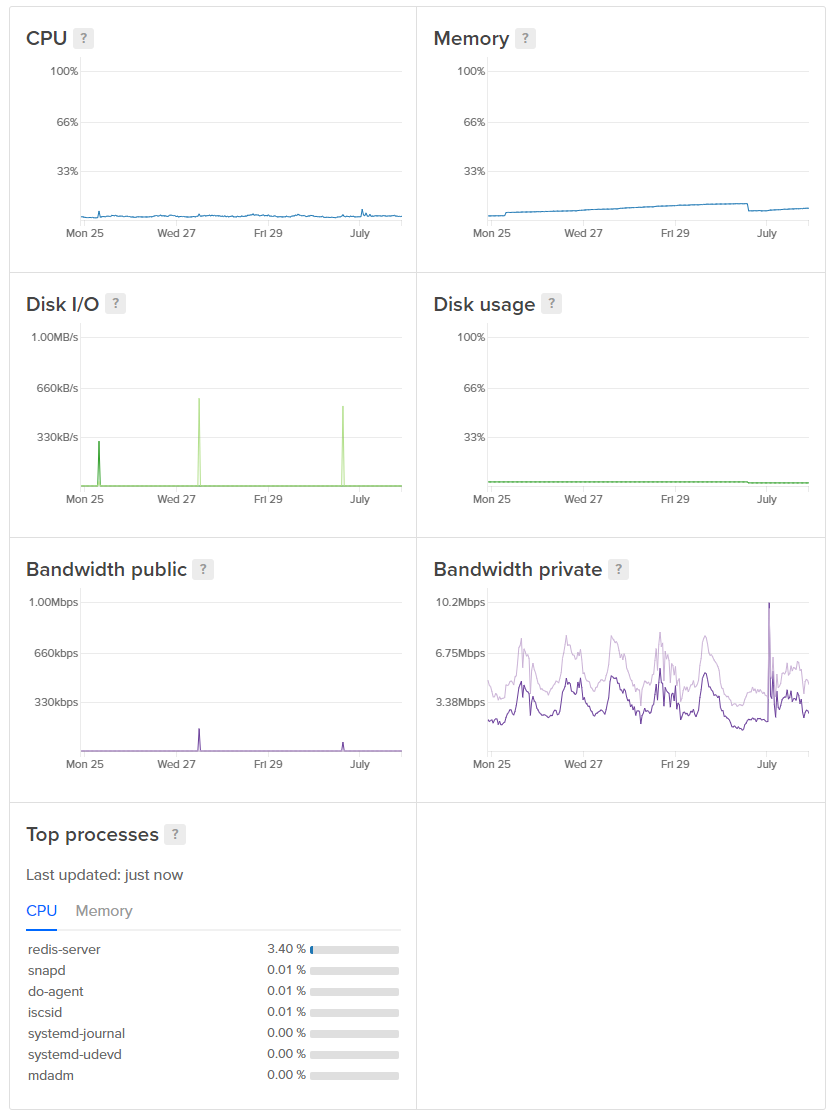
Once reports are in the Redis cache they're buffered for 10 seconds so we can stack duplicates and a consumer will come along and grab the entire contents of the cache. Doing it this way allows us to do batch inserts into Azure and instead of inserting single reports we can often insert multiple of the same report, saving us a lot of resources. The consumer have a fairly steady life and take it in turns to grab the contents of the cache and process them into Table Storage.
Once the consumer fire off the reports it's over to Azure and Table Storage.
Azure Table Storage
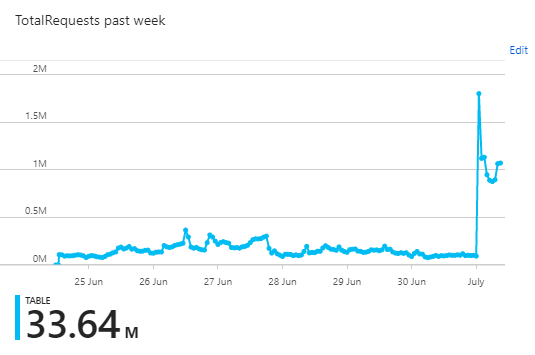
We're now at the final resting place for our data and we do a fair amount of transactions into Table Storage. Again, you can see our monthly peak here as customers all renew their monthly quota.
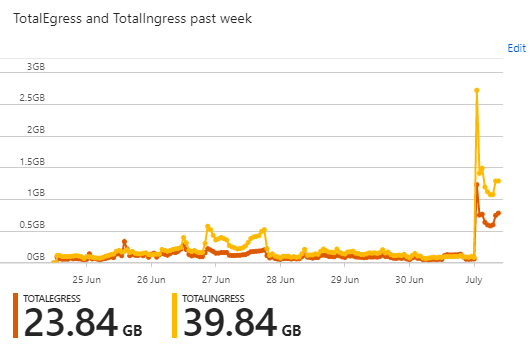
Because we're inserting the report payloads into Azure, and the UI is querying them back out, we have a good chunk of ingress and egress bandwidth too.
Despite all that action though, and sudden spikes in volume, Table Storage is solid and we see great availability and low latency on transactions.
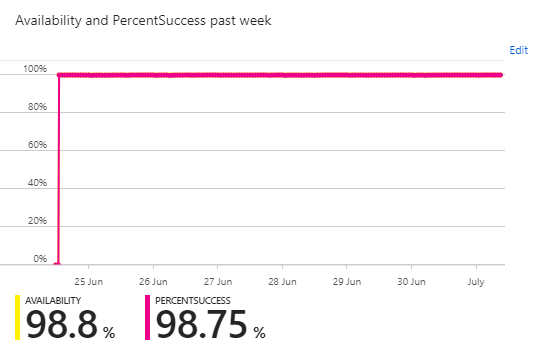
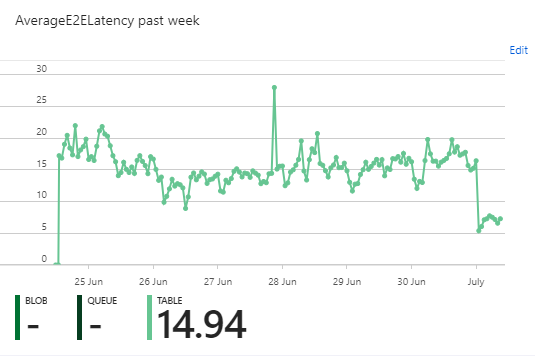
Ignore the dips at the start of the graphs, that's a bug in the Azure Portal UI which they've yet to fix, despite me pestering them. All in all though, it's not bad going and one of things I love about Table Storage is not having to care about disk space, backups, redundancy, throughput provisioning or any of that stuff. We literally just fire reports in and forget about the rest.
GitHub
From a few months after I started Report URI I moved over to GitHub for source control. Since then, we've seen a lot of new code added and a lot of old code removed.
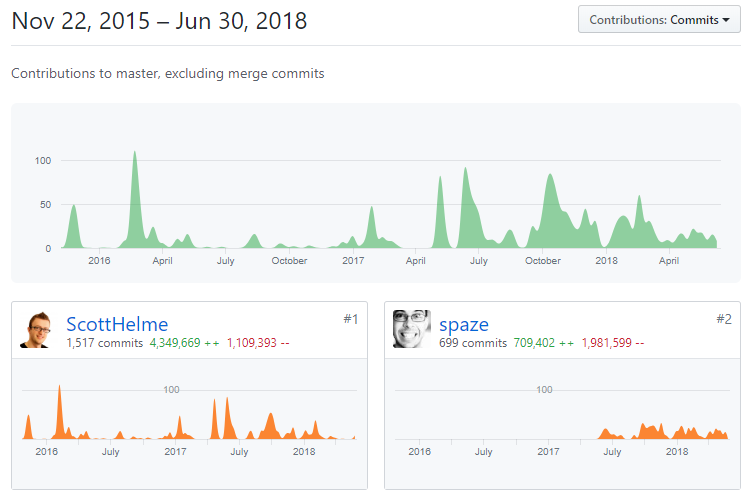
Michal joined us a year ago and recently wrote up his experience in the first year.
I joined @reporturi, the real-time security reporting tool by @Scott_Helme and @troyhunt, almost exactly a year ago. Since then I'm mostly deleting code: GitHub says I've added 709,402 more lines and deleted 1,981,599 lines :-) https://t.co/yxalXXUn9h
— Michal Špaček (@spazef0rze) June 29, 2018
He seems to have enjoyed running around and deleting my code at least!
A long road behind us, and a long road ahead
I wrote a blog on 1st June 2017 called Analysing massive traffic volumes on report-uri.io and I was amazed that we were peaking out at close to 2,000 reports per second. That was a huge achievement for the service back then and whilst only 13 months ago, it was a very different time! Things have come a long way since then.
We peaked at 44M requests to @reporturi in an hour yesterday. The busiest single minute I saw was 949k requests or an *average* of 16k requests per second for that minute. We might be onto something with this reporting thing @Scott_Helme 😎 pic.twitter.com/HLVa90pqKA
— Troy Hunt (@troyhunt) June 22, 2018
That's an 8x multiplier on traffic in a year and that's on top of everything that came before it. In our first month Report URI did a fraction over 10,000 reports, today we can peak out at over 16,000 per second! Our infrastructure has been refine and optimised, it's efficient and we have the capacity for a lot more but everyone involved is a builder. We create and hack things, we write code, we're technical people. We don't do marketing or sales. Not because we don't want to, but because we lack the skills. All of our growth so far has been organic and in the coming year I really want to step on the gas and see where we can take this thing. If you have feedback that could help us, guidance you could provide or just want to help us out and tell others about the service that'd be great! Any input will be most welcome and my DMs are open and there's the comment section below. I'd love to come back here a year from now and publish another blog on how we've smashed all expectations and are processing more reports than we ever thought possible.