
With a significant amount of work having taken place on my car over the last year or so, a lot of effort also goes into making sure nothing goes wrong. Especially with the engine being tuned to produce so much power, I want to go through the process of taking logs and examining them so you can spot problems before they become expensive.
The Series
In Part 12 and Part 13 with the introduction of a new High Pressure Fuel Pump, a Stage 2+ tune and ethanol fuel with methanol injection, the power output of the mighty B58 has soared beyond 500bhp, and soon, much higher. Producing that much power from an engine that left the factory with only ~330bhp comes with additional strain and the risk of bigger issues so in this blog post I'm going to go through the process of monitoring the engine and inspecting log data to make sure there are no nasty surprises brewing.
Taking Logs
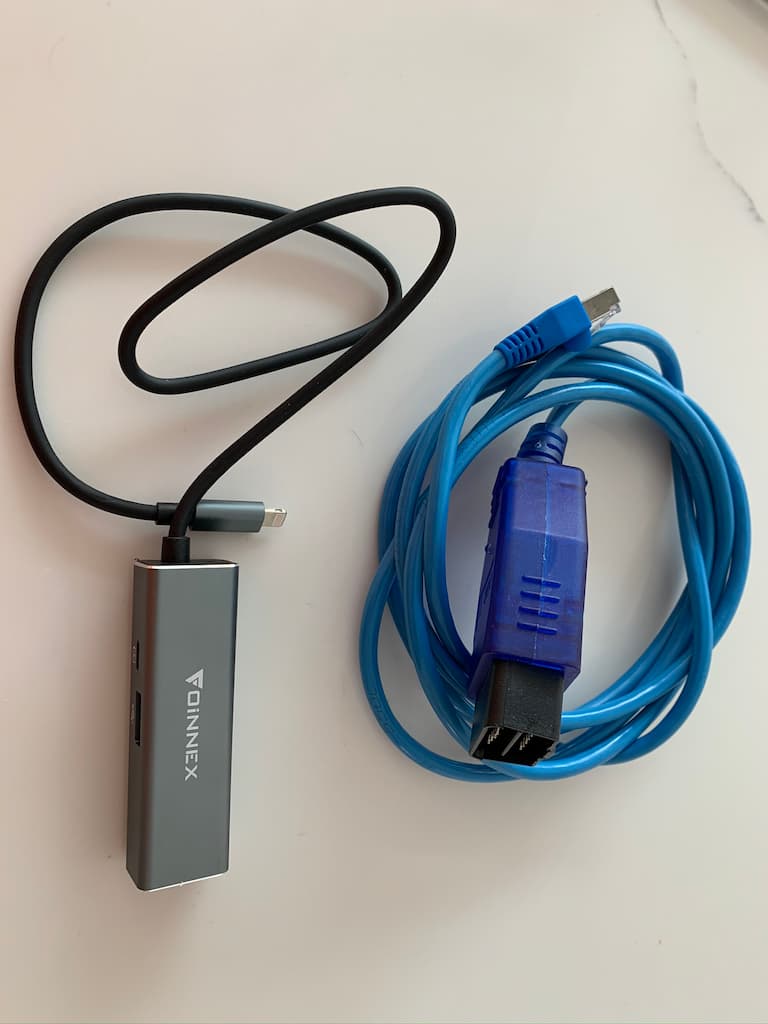
There are a heap of different ways to take logs from your car and it can be super cheap to get started. There are Bluetooth and WiFi dongles you can get from eBay or Amazon that connect to the OBDII port in your car. From there they can connect to your phone and then there are free or very cheap apps in the app stores that will allow you to view the data and record it. With buying the OBDII adapter and the app, you could probably be up and running for £40 ($55 USD) or less. I'm going to be using my tuning software, BootMod3, because along with being able to flash the ECU to tune the car, it's also pretty good at taking data logs for examination. My setup isn't wireless either, it's a wired Lightning to Ethernet adapter but that really doesn't change anything.
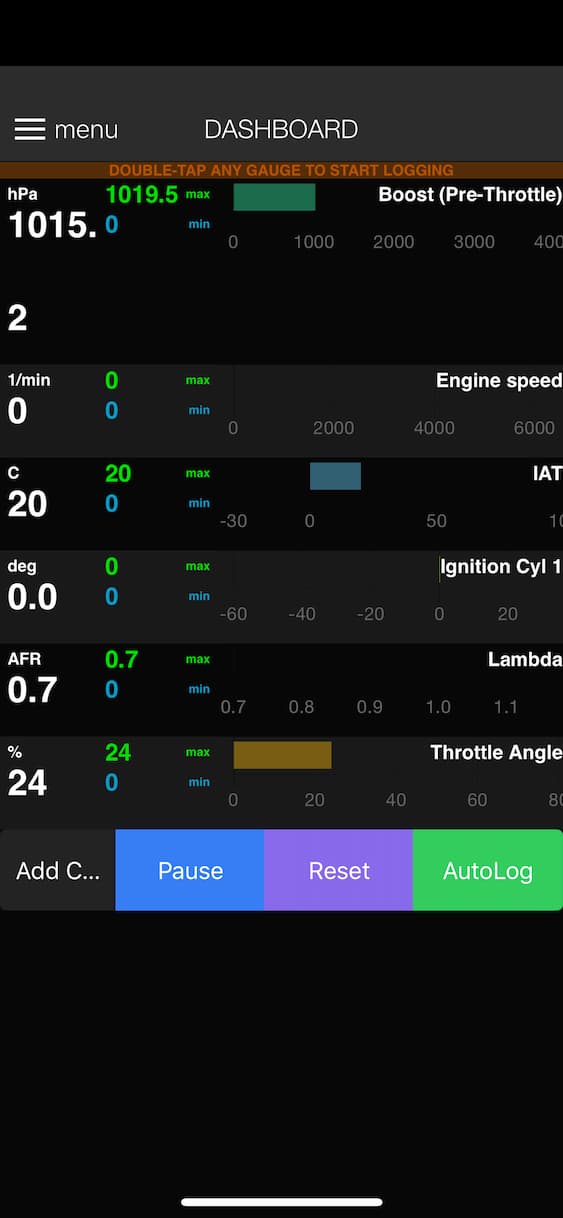
I won't go into details of how you create a data log as the process is going to be different with every app or bit of software out there, but it's generally quite a simple process. For me, in the BootMod3 app, I go to the dashboard that shows live data and simply double-tap anywhere on the screen to start recording the data and double-tap anywhere to stop recording data. This makes it quick and convenient to do when the phone is mounted in the car because you need to take a log in some pretty specific scenarios.
The most likely time an engine will show an issue, or the beginning of an issue, is when under full load. A log needs to be taken when you have the accelerator pedal pinned to the floor, known as Wide-Open Throttle (WOT), and ideally through a couple of gears like 3rd and 4th, or maybe even 5th. This is so the car has time to be held under load for a prolonged period of time, across the full range of revs and so that we have enough data to analyse. This can mean that taking a log is difficult depending on your local speed limits so a private road, race track, dyno or runway can certainly come in handy!
Analysing Log Data
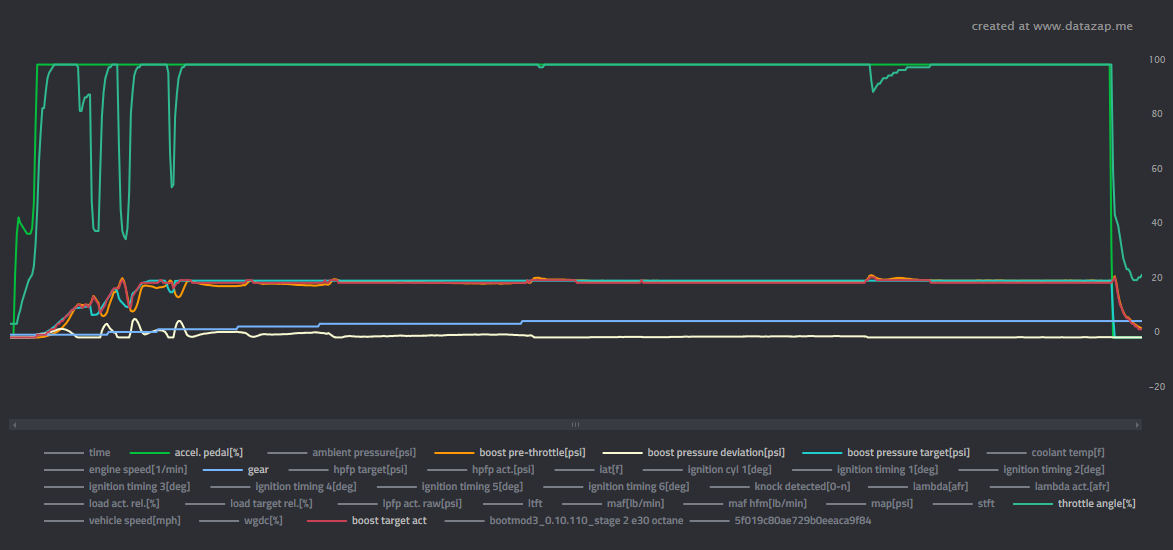
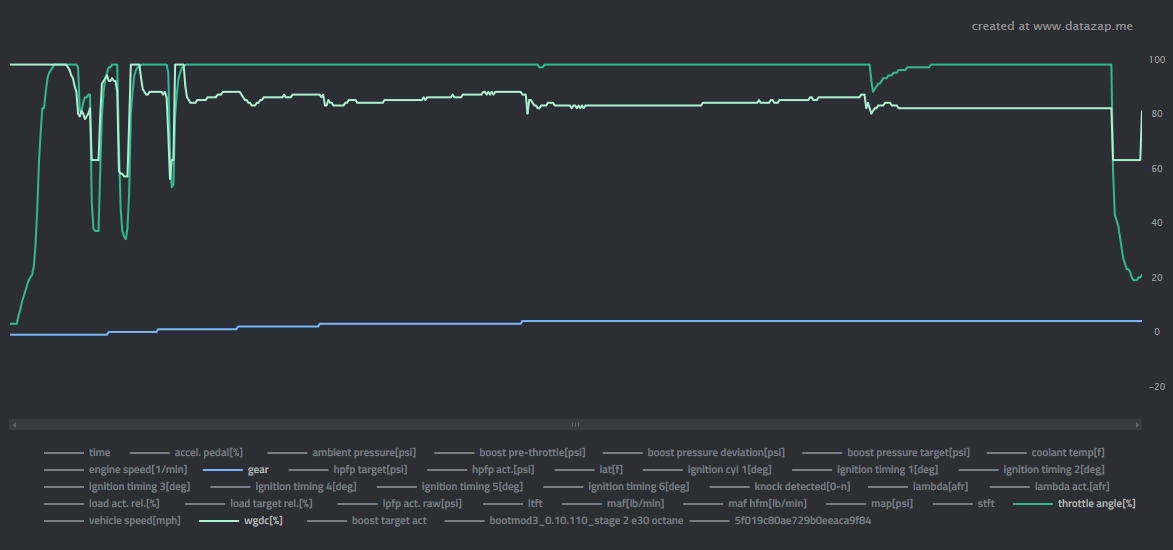
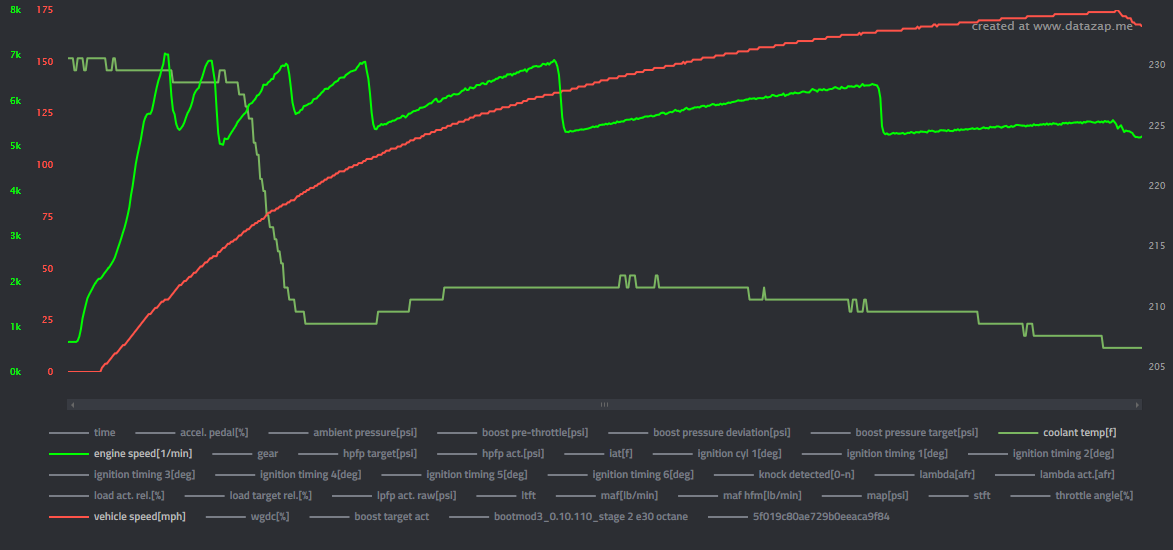
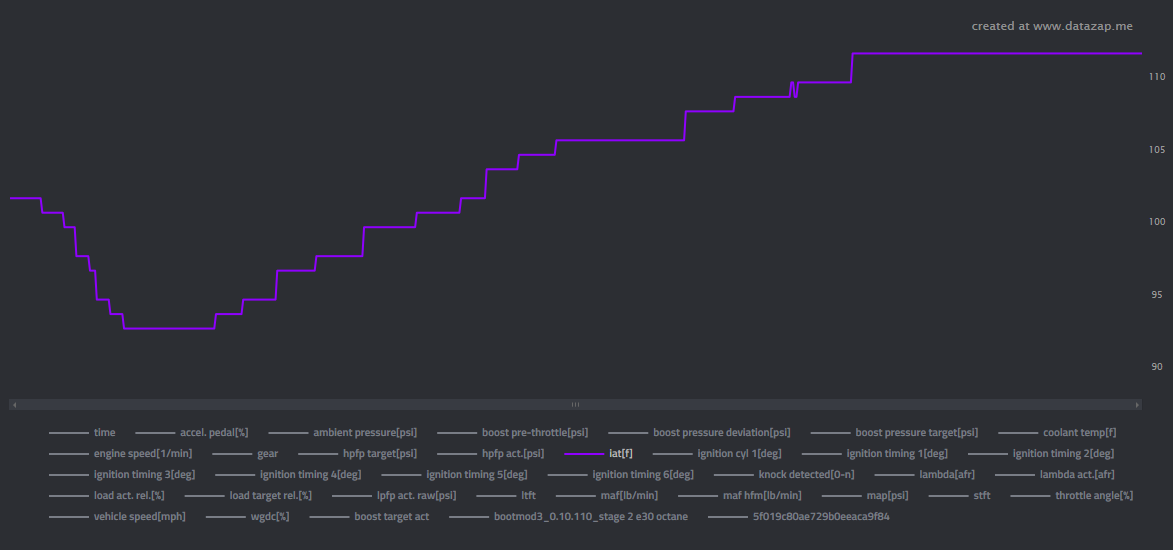
I've found that being able to visualise data in a nice way is massively important when analysing log data and the best tool I've found so far is DataZap. BootMod3 do have their own graphing built in, and you could just as easily open a CSV of your log data in Excel and make graphs too, but DataZap is built for the job and it shows. You upload your log data, typically a CSV file, to DataZap and get the ability to view various bits of data at the click of a button. The following graph shows the full length of the log I will be examining, with the green line showing my accelerator pedal position and the red line showing my speed. At the start of the log I nailed the throttle to the floor but I had my left foot hard on the brake so the car won't move and you can see the accelerator pedal position jumps to about 40%. This is the launch control in the car taking over and setting the accelerator pedal / throttle angle for the perfect launch and you can see the speed of the car is still 0mph at this point. Once I release the brake the wheels spin up and then the ECU gives me 100% throttle very quickly and off we go! I held the accelerator at 100% for the entire duration of the pull and you can see that all the way up to 175mph (282kmh) when I let off (the vehicle is currently speed limited to 175mph but it won't be soon!).
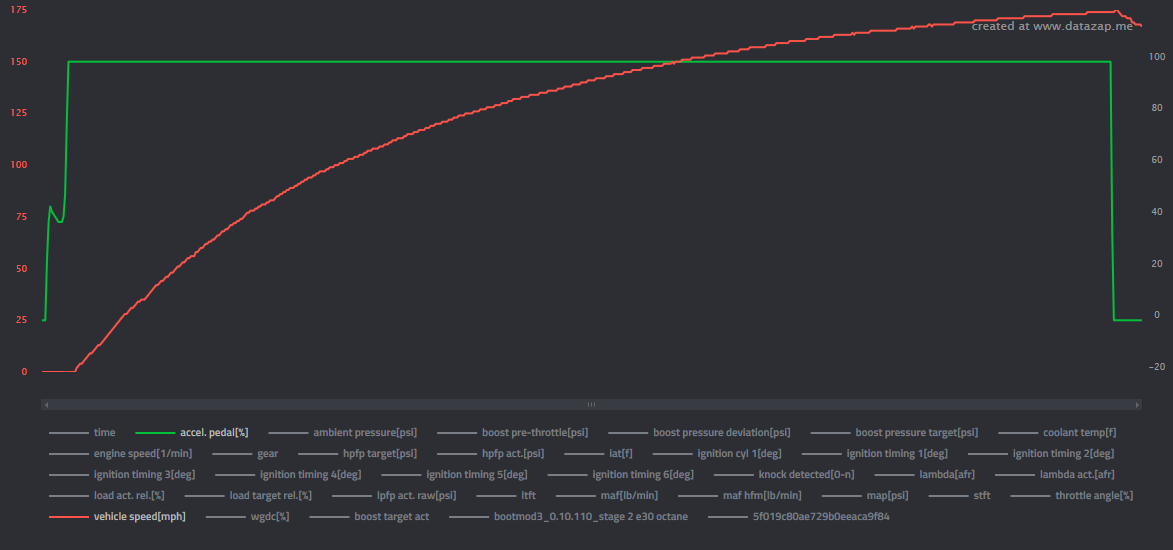
This is a perfect pull because I went all the way through the gears from 1st gear to 7th gear with the throttle wide open and the log data from this will be great for analysis. If you want to see what this actually looks like I took a video of the instrument cluster in the car too.
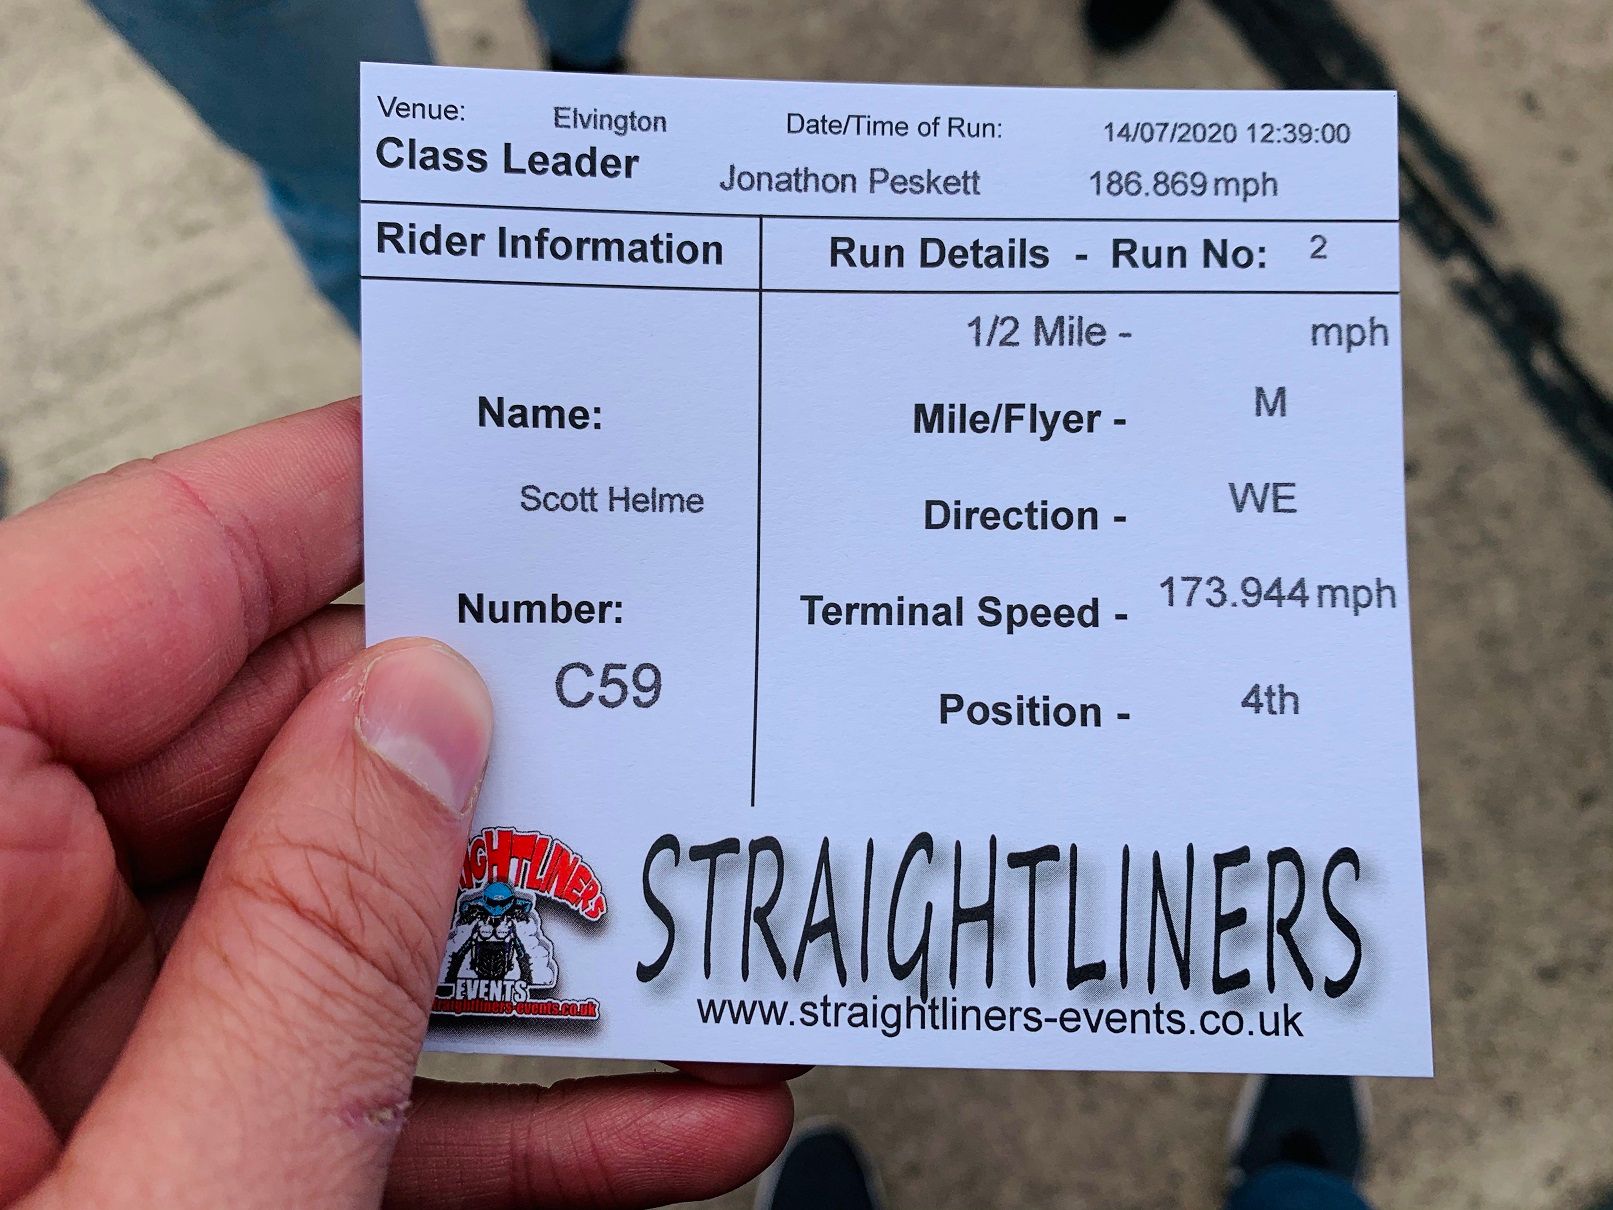
The instruments stop reading at 160mph but I've since reprogrammed the digital readout so it will read beyond 160mph next time, but you can see the revs continue to climb well beyond 160mph! Here's one of my timing slips that shows my official speed for the event too. Not bad for a second run!
Anyway, back to analysing log data and there is no 'right place' to get started. If you suspect an issue with a particular thing in your car, obviously you should start there but this is how to read logs overall and look for problems or confirm everything is OK.
Boost Pressure
For an engine with forced induction, boost pressure is a great sign of the health of your turbocharger (or supercharger). You want to take a look at several metrics including your target boost pressure (what your ECU wants) and your actual boost pressure (what you're actually getting).
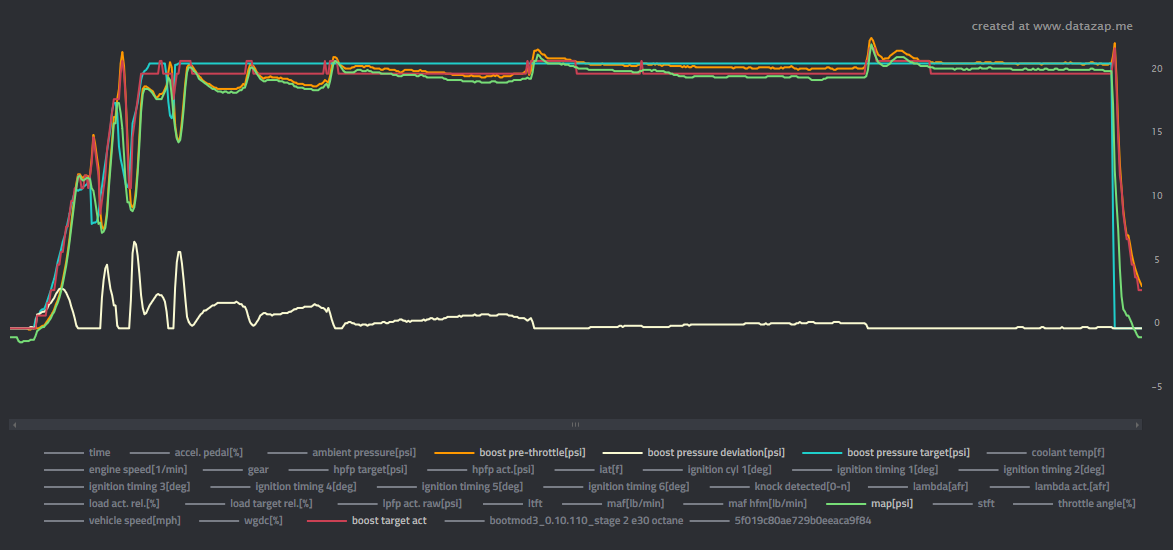
Here you can see that my boost target is 20.8psi during WOT and that's what my ECU wants from the turbocharger to give me full power. The boost pressure actual is generally sitting around 20.xpsi, which is very close to what is being asked for, and that's a good thing. You can also see that my boost pressure in the manifold and before the throttle are closely matched, which is great. My data log contains a boost pressure deviation which saves you having to calculate the difference and also allows you to look for obvious points where you have large deviations, because a large deviation here is a bad thing. During a gearshift it's perfectly normally to see a fluctuation in the boost pressure deviation. There's a sudden change in the demand for power, the flow of exhaust gasses will change dramatically and the turbo has to slow down and then speed up again for the oncoming demand in the new gear. If you have large deviations you can rule them out by plotting your current gear and the throttle angle on the same graph.
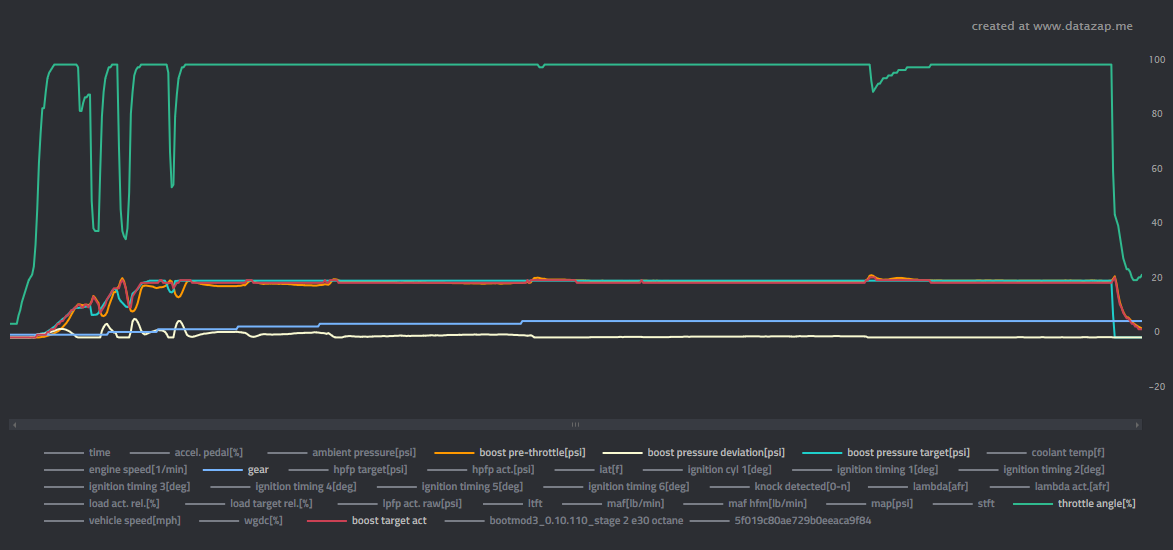
Here you can see that my boost pressure deviations all align with a gear shift and the consequent throttle closure and the boost pressure gets right back on track immediately after the gear shift. It's worth noting that while you experience a throttle closure here during the gear shift, if I overlay the accelerator pedal position you can see my foot is still pinned at 100%.
I have an automatic transmission in my car (the ZF8HP50) and not a manual transmission. If you drive a manual you will be very familiar with releasing the accelerator pedal momentarily whilst changing gear using the clutch and you wouldn't keep the accelerator on 100% during a gear shift. What you're seeing here is the ECU backing off on the 'accelerator pedal' for me even though I've kept it pinned to the floor for much the same reason you release the accelerator in a manual car; there needs to be a dip in power whilst the transmission physically changes gear.
Everything in this section looks good though and I have no concerns about my turbo from this data. It's hitting boost targets with a marginal deviation and the large deviations are explained by the gear shifts, all is well. If you see your car consistently struggling to hit boost targets then something is wrong and you should find out what. It could be as simple as a boost leak, a bad joint or small crack in a pipe allowing that pressurised air to escape, or it could be something far worse like a turbo on the way out. Either way, if you can't hit boost targets, you have a problem and you need to investigate.
Wastegate Duty Cycle
Following along on the health of my turbocharger whilst we're here then, the next thing to take a look at is Wastegate Duty Cycle, or WGDC. Loosely translated this is 'how hard your turbocharger is working to achieve the boost target'. Having a WGDC of 100% means your turbo is being pushed to the absolute limit of its capability, and a lower WGDC means your turbo is doing what needs to be done without working flat out.
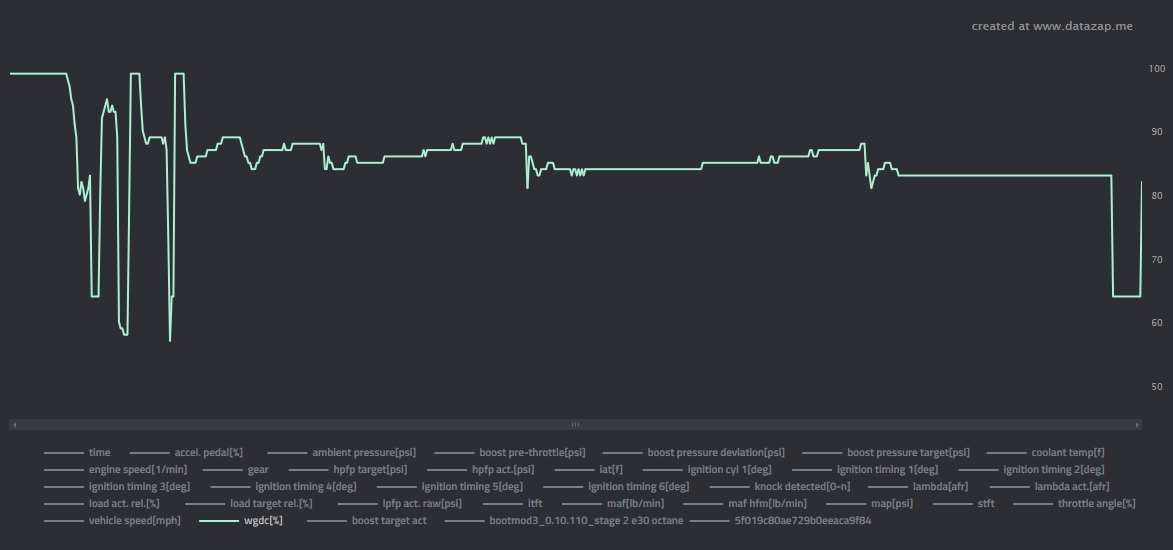
Looking at my WGDC graph we can see quite some activity, so let's walk through it. At the start of the log the car is stationary and launch control is active so the turbo is wound up to 100% ready for the launch. Shortly after we can see a couple of wild fluctuations where the WGDC drops right down and the back up to 100% momentarily. If we overlay the gear and throttle position again we can see that these huge fluctuations occur during a gear shift which is fine, so long as things recover immediately. There's a lot happening during a gearshift and the sudden drop in boost target will cause the WGDC to plummet and then the high demand for power once the new gear engages causes it to skyrocket to 100%. As I say, this fluctuation is fine as long as you're not hanging up near 100% WGDC.
My WGDC seems to be sitting around 86% for most of the pull here and that's perfectly reasonable for an OEM turbocharger being pushed far beyond it's intended power output. If you see a WGDC constantly sat at, or very near, 100% then you may want to consider what's wrong. Referring back to the previous section, if you're not hitting boost targets because you have a boost leak then your WGDC will be at 100% constantly. The turbo is working as hard as it possibly can to hit a target that it can never hit due to the boost leak and that only means one thing for your turbo, premature death. If you need to keep your turbo at or near 100% WGDC to hit your boost/power levels then it may be time for a hybrid or larger turbo because no turbo will tolerate that for protracted periods of time. Considering I'm around 86% WGDC I'd even say there was a little more to squeeze out of mine and I'd be comfortable around 90%.
Fuel Pressure
Now that we've looked at the turbo and all of that air going in, we should probably consider the fuel situation and what's going on there too. As I mentioned in Part 13, you typically have 2 fuel pumps in your car, a Low Pressure Fuel Pump and a High Pressure Fuel Pump. The LPFP simply moves fuel from the fuel tank to the engine and the HPFP has to crank that pressure all the way up to the ridiculously high values required for direct fuel injection. The HPFP is the one you typically need to keep your eye on.
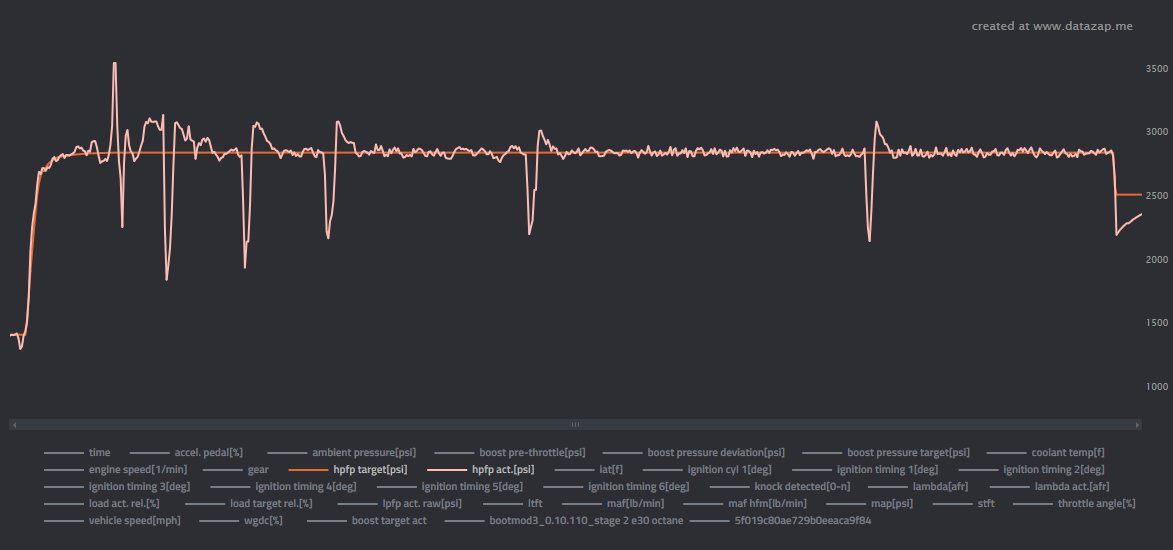
As you can see, the HPFP target is sitting solid at 2,880psi which is what the ECU wants, but of course you can never achieve a perfectly flat 'actual', the target is just the most desired state. The actual pressure is very close and those minor fluctuations along the whole graph are well within tolerance. We see some big fluctuations again but I'm not immediately concerned about those as my guess is they will align with gear shifts at which point they're expected.
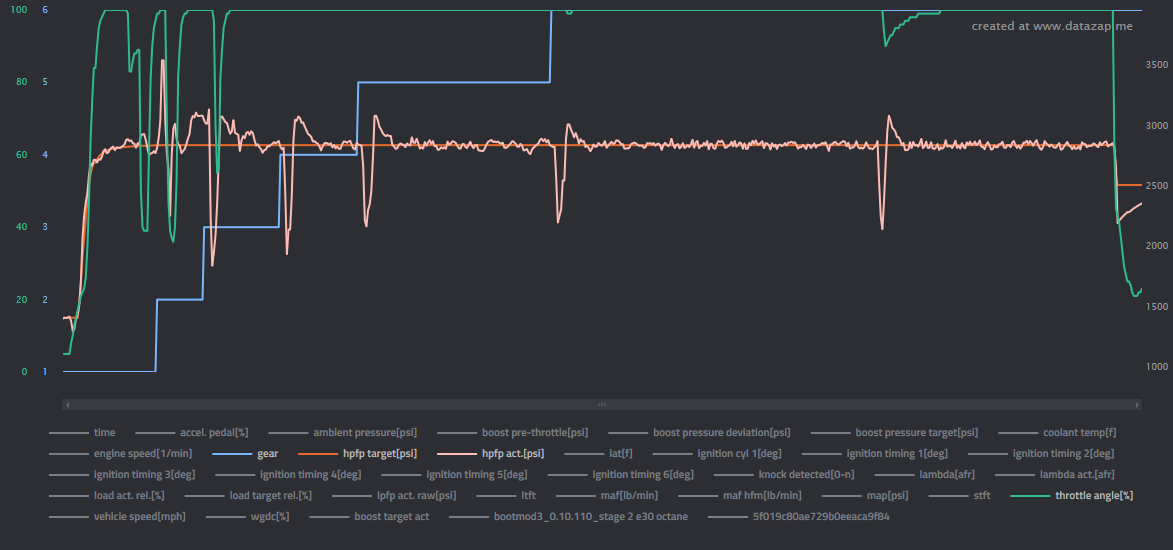
If you see a large fluctuation happening and you're not shifting gear or changing throttle position, you probably need to be concerned. A typical thing to see happen is that the fuel pressure will 'crash' to a very low value, outside of tolerance, and that means your engine is not getting enough fuel. In this scenario when you're running lean (not enough fuel) you can risk 'leaning out' which has potentially catastrophic consequences for your engine, and I'm talking big repair bills. You can typically crash your fuel pressure if you're asking too much off the HPFP and the engine is demanding more fuel than can be provided, which is why I upgraded to a new HPFP in the previous Part 13 blog post. When chasing big power you need more fuel and especially when using ethanol as you need more ethanol by volume than the fuel you're replacing, so it's an even larger strain. If you do see a HPFP problem related to fuel pressure crashing, it can also be worth checking your LPFP pressure too.

Here you can see my LPFP is sat rock-solid at 72psi, which is expected and easier for the LPFP as you can see it doesn't have to work nearly as hard to hit 72psi compared to 2,800+psi of the HPFP. This is why it's typical to see issues with the HPFP first, but it never hurts to rule out the LPFP as the LPFP will starve the HPFP if it isn't working right, causing the HPFP to crash.
Fuel Trims
If you have any concerns about your fuel pressure, or even if you think everything is good, the next thing to check is your fuel trims. We have two things to look at here, Long Term Fuel Trim and Short Term Fuel Trim. This is exactly what you want to see for your LTFT, a big flat line on 1.0 exactly.
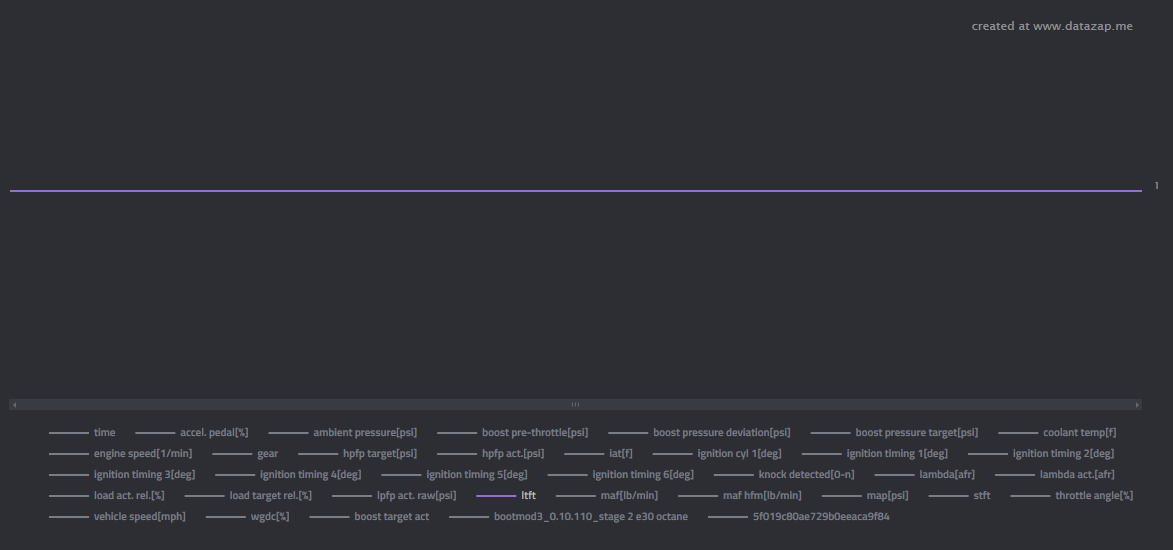
Your fuel trims are basically 'what adjustment is the ECU making to fuel injection on the fly'. A fuel trim of 1.0 means that the ECU is injecting exactly the expected amount of fuel to make everything work. If you have a fuel trim of 1.1 then the ECU is adding an extra 10% fuel to make things work otherwise your engine would be running lean without enough fuel and that's bad, as discussed above. Likewise, a fuel trim of 0.9 means the ECU is cutting fuel because you're running rich and whilst running rich isn't quite as much of an immediate threat as running lean, it's still problematic. Your LTFT is what the name suggests, a more long term look at what your ECU is doing overall. There can and will be minor fluctuations coming up in the STFT, but you really should expect LTFT to be a flat 1 on this graph. Now... STFT.
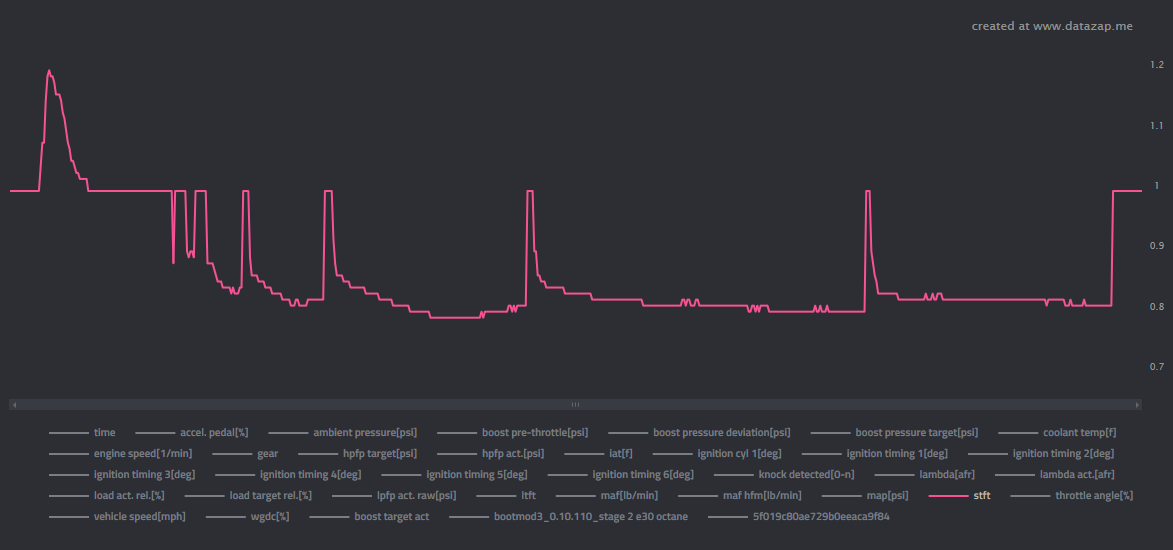
My STFT graph probably isn't the best to show you for what a good STFT graph looks like but there's an easy to explain reason for this. Very similar to the LTFT, you're looking for as close to a flat line on 1 you can get here, but that's not the case for me. A STFT of 1 means the ECU is using exactly as much fuel as it was expecting and not having to make any changes due to something happening that it didn't expect. In my case though, something is happening that the ECU didn't expect. Back in Part 11 I talked about my Water/Methanol Injection System which injects additional fuel into the intake tract on my car. This serves as a safety net for the fuel system and quite a considerable cooling aid when the car is getting hot. Because extra fuel is being injected into the intake air by a 3rd party system and the ECU has no knowledge of this system, the ECU suddenly finds more fuel than it expected in the combustion chamber. To counter this, the ECU needs to cut fuel and as a result you see my STFT take a dive. At the lowest point there I have an STFT of 0.79 which means the ECU is cutting 21% of fuel! What you are looking for here though is unexpected deviations. If you're having issues above with the fuel pressure then as the fuel pressure crashes, the engine will be starved and run lean, causing your STFT to spike as the ECU demands more fuel to replace what is missing. This is how many of these graphs and metrics can start to intertwine and one can lead to the other during an investigation into a problem.
Air-Fuel Ratio
Your AFR is just what the name implies, the ratio of Air to Fuel present inside y0ur engine, and it's a great indicator of how well your engine is running. Your ECU monitors your AFR using something called a Lambda Sensor which sits in the exhaust on the way out of your engine. By monitoring the amount of oxygen presnt in the combustion by-products leaving your engine, the ECU can detect if there is too much fuel being injected (running rich) or not enough fuel being injected (running lean). A stoichiometric mixture is a mixture that has the perfect AFR to ensure there is enough air (oxygen) to completely burn all of the fuel present, which varies based on the fuel type, but gives the perfect efficiency during combustion, no waste either way. For a petrol (gasoline) engine the stoichiometric mixture is 14.7:1, meaning that for every 1g of fuel injected, 14.7g of air would be required to ensure that 100% of the fuel is burnt using 100% of the oxygen in the air without any of either left over, a perfect balance.
The interesting thing is that we don't often target a 'stoich' mixture, especially not when looking for big power and working under load.
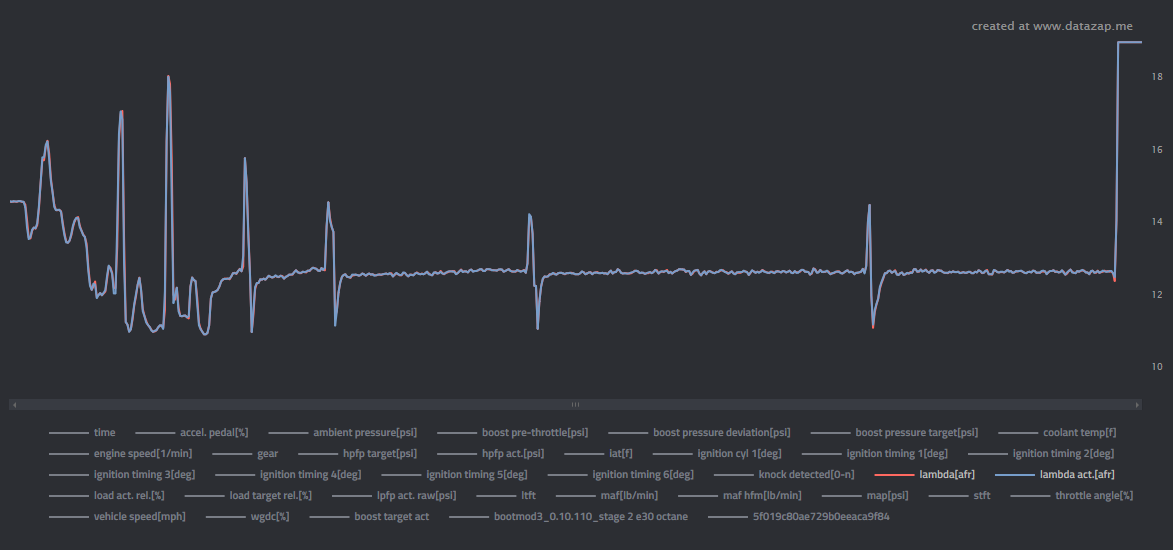
From that graph you can see that my AFR is around 12.73 which is a good way off a stoich mixture of 14.7 which you might expect. The reasons here can be many, and different cars and fuels will have different characteristics, but it's not often that you're going to see a stoich AFR under load, especially not WOT. First of all, an AFR of 12.73 means we're running rich as there is less air, 12.73g, for each 1g of fuel now so we have more fuel, it's a 'rich mixture'. The benefits of this are generally two main things, thermal management and power extraction. The big one is temperature and when an engine is being pushed this hard, it's generating a lot of heat. Due to the high rpm there is a large number of combustion processes taking place, each one generating heat, but a stoich burn generates even more heat and heat is bad for an engine because it can lead to knock. I won't explain knock, but trust me, it's bad and you absolutely do not want knock. Ever. By running a rich mixture you can reduce temperatures inside the combustion chamber because converting a liquid into a gas (phase change) takes energy. All of the extra fuel being injected but not burnt is evaporating and 'consuming' energy in the form of heat. The evaporated fuel doesn't get burnt and then release heat so it carries that heat out of the engine and into the exhaust, ultimately reducing the temperature in the combustion chamber. The other reason is achieving more power, partially because it's running cooler and a cooler engine will yield more power, but also because of imperfect mixing of the fuel in the air. The air/fuel mixture doesn't have long to burn and the fuel isn't perfectly, evenly distributed throughout the air mixture. By injecting more fuel we can account for the uneven distribution of the fuel and give more of the fuel a chance to burn which allows us to extract more power from a given combustion stroke.
Looking at the AFR can also be a good indicator of fuel or air issues because if you're ratio is a long way off, or fluctuates wildly, it can give you something to investigate. When chasing power, it's very bad to run your engine lean so always make sure to keep an eye on your AFR.
Temperatures
We burn fuel in a car to convert the chemical energy in the fuel into kinetic energy to move us forwards. The problem with this process is that it isn't a very efficient conversion from chemical energy to kinetic energy and 60%+ of the chemical energy is converted to waste heat instead! I'm sure many of us know that engines get hot and we have things like radiators and fans to keep them cool, but heat is the enemy, especially when tuning a car for more performance. As the car performs further outside of its intended parameters it's generating a lot more heat which means it's lack of ability to cool itself effectively can become a problem, so keeping an eye on temperatures is very important. The radiator and fan on your car were designed to deal with a certain amount of heat and we're suddenly throwing a lot of extra heat at them and expecting them to cope.
The first thing to look at is your engine coolant temperature and to make sure things are looking healthy. Here's my coolant temperature graph, and it does look a little odd at first glance!
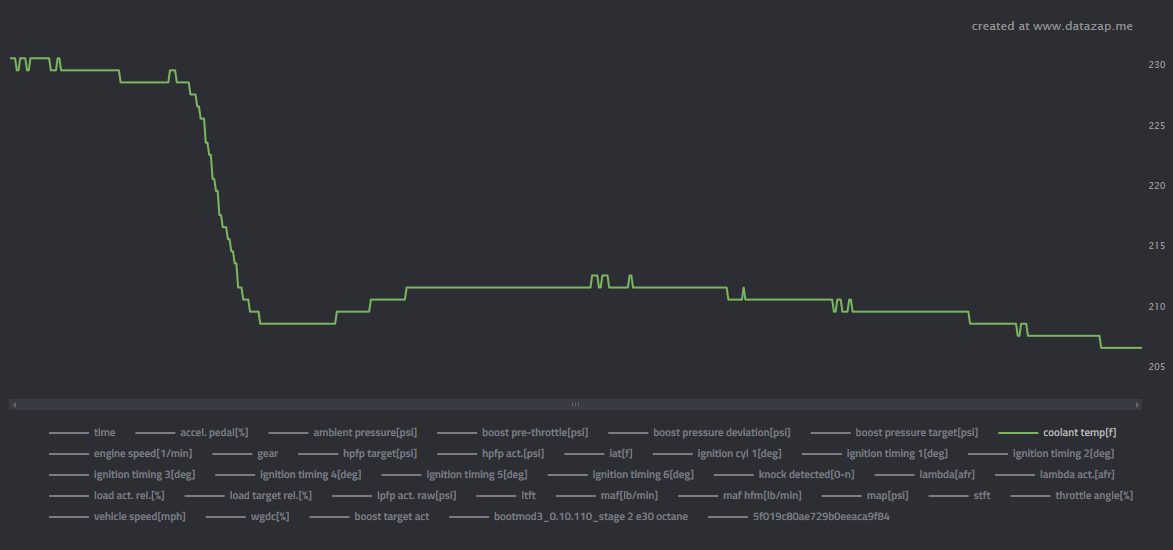
As you can see, at the start of the run when waiting for my launch, the coolant was sitting around 110c (230f) and then shortly after launching, the coolant temp took a sharp nosedive and remained quite low for the remainder of the run, around 98c (210f). This seems weird at first but there are explanations for this high starting temp and the sudden decline. First of all, when sat waiting for your chance to launch down the runway (in my case when I took these logs) you're parked in a queue with your engine running. There is no airflow to help keep the car cool and it's sat there progressively getting warmer, which is why there are often higher temps at the start of a log like this. Also, with the very sharp decline in temp after the launch, people might not expect to see such a sudden sharp drop but this is a combination of the engine coolant pump being mechanically driven and airflow over the radiator as speed increases. With the engine coolant pump being mechanically driven, the higher the rpm of the car, the higher the flowrate of coolant through the system. Also, with higher vehicle speed comes more airflow and thus cooling for the radiator, allowing temperatures to drop quickly even though the engine is under significant load. If I plot my engine RPM and speed, along with the coolant temps, you can see how they relate to each other.
I don't have oil temperature logged in my data but that's also another thing to keep an eye on and you may see similar behaviour, but you're looking for oil temps to be kept well under 120c (250f) at all times. Most cars will have an oil cooler that links into the engine coolant circuit with a heat exchanger so the oil is kept cool by the engine coolant. That usually means that having engine coolant in a good temp range means your oil should be fine too. That said, some vehicles don't do this so it is best to keep an eye on things and not make assumptions. All the way back in Part 5 I removed one of my air vents in the car and replaced it with a gauge that, amongst other things, always shows me my coolant and oil temps as they are essential.
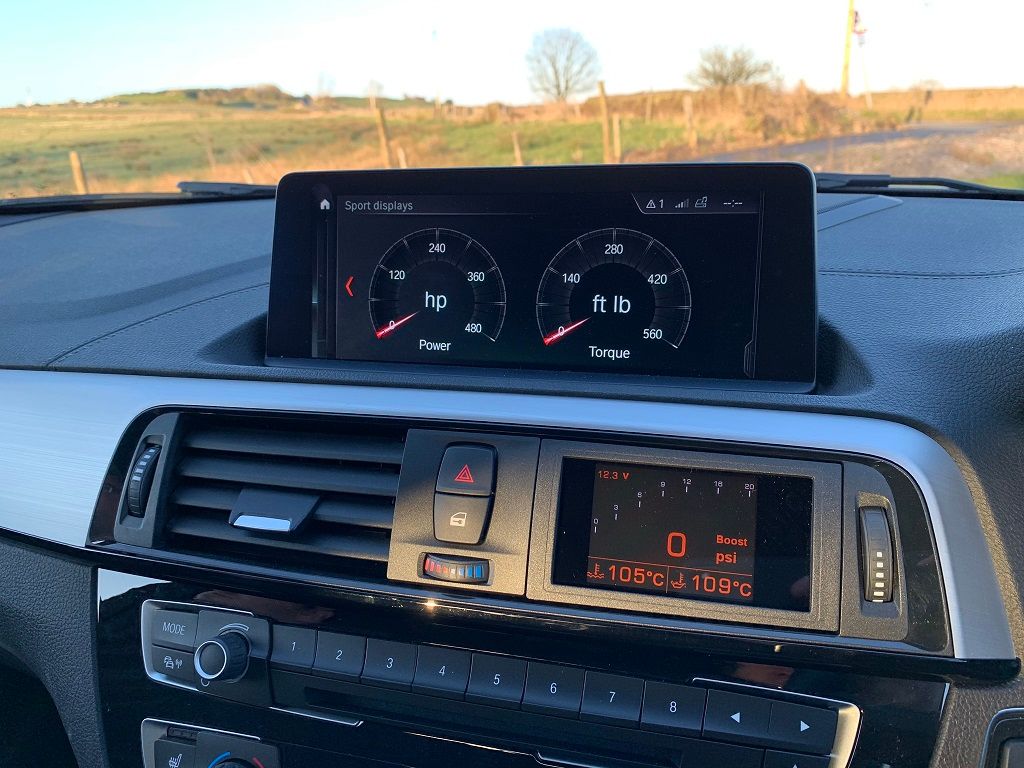
The next temperature to keep an eye on is the Intake Air Temperature, or IAT. This is the measure of how hot the air being fed into your engine is and also another important temperature to keep your eye on. Here's my IAT graph showing the variation between 34c (93f) and 44c (112f) during the log.
The reason the temp is slightly higher at the beginning is because I was sat with my engine idling waiting for my turn to launch down the runway. As you're sat there the engine is producing heat and heating up all of the components around it. Once you then set off, you have all of the built up heat to get rid of and once the airflow is introduced, you can see that happening. The temperature then starts to pick up again and this will largely be due to my car being turbocharged. As the exhaust gasses get hotter, the turbo gets hotter, everything around it gets hotter. You're also compressing air, which heats it up, so everything is adding more heat. The charge cooler and turbo cooling circuit in my car have electrically driven auxiliary pumps so they will spin up to full power as soon as they are needed and also I have a water-to-air charge cooler with a radiator up front for cooling, but even with all of that, there's only so much cooling you can do. You can see that the line tops out at 44c (112f) and holds there, not increasing further even though revs and load are still increasing. Once you've hit what your cooling system is capable of achieving, those temps won't drop unless you change something, but as long as they're aren't climbing too high, everything is OK.
In a different ambient temperature the temperatures I see here will vary, of course with colder ambient air help keeping them lower and warmer ambient air keeping them higher. That said, all of these temperatures look great and there's nothing to worry about here.
Ignition Timing
The grand finale, and probably the biggest and most important thing to keep an eye on for my engine certainly, is Ignition Timing. Ignition Timing is a measure, in degrees of rotation, of the crankshaft position prior to the piston reaching Top Dead Centre (TDC) when the spark plug fires on the compression stroke to ignite the air/fuel mixture and start combustion. That all sounds rather like nonsense and I'd probably need a blog post a whole lot longer than this one to explain what ignition timing is and why we like it, but there are some things you can still look out for to spot issues of epic proportions before they cost you money.
Timing advance is a way to extract a lot more power from an engine and it's measured in degrees (°) as I said. The more 'timing' you run, the larger the number of degrees of timing advance you have. You want as much timing advance as you can possibly get without running into our mortal enemy, knock. You can get knock because you have a bad batch of fuel that's low quality, because your engine is too hot or because you're running too much timing (amongst other causes). Again, I could write a whole blog post, a lot longer than this one, on what knock is, but all you need to know is that knock is bad. Unless you fancy a huge repair bill, or possibly want to witness your engine turn itself literally inside out, you do not want knock. It's often catastrophic.
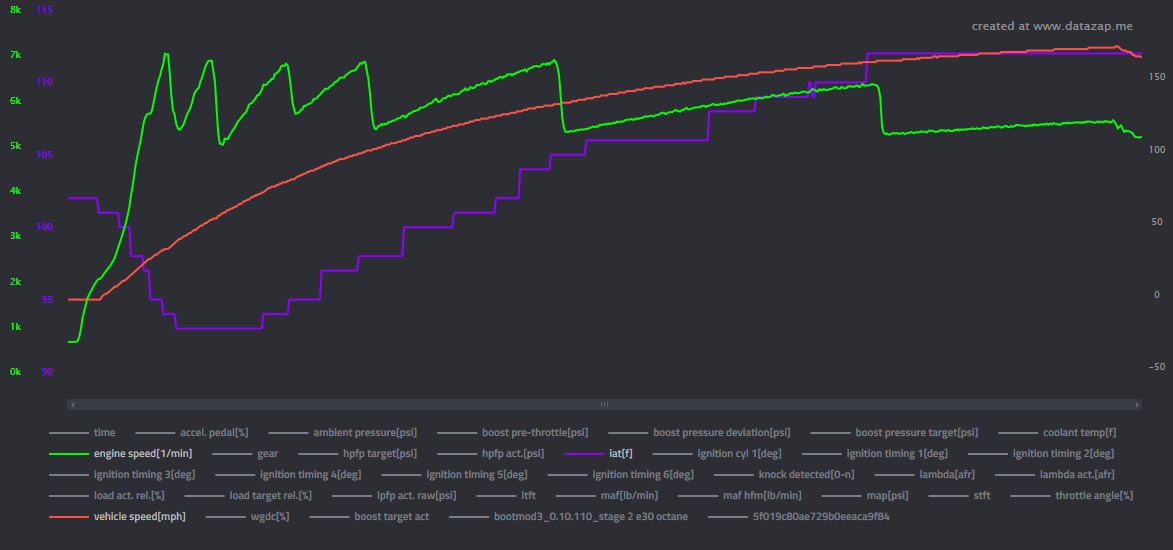
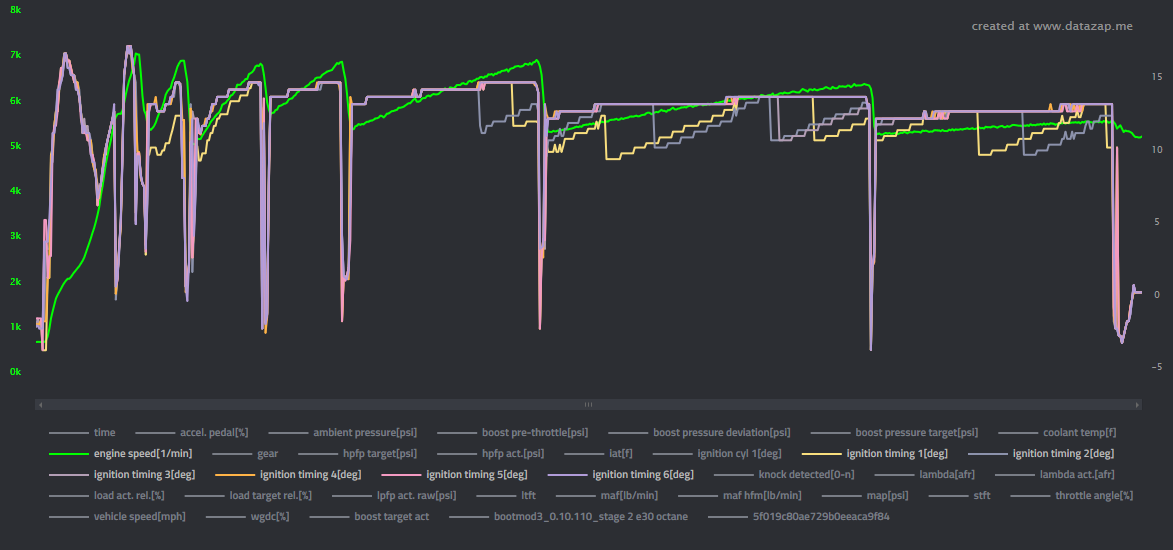
Here's my timing graph showing the ignition timing of each of my 6 cylinders throughout the run.
What you want to look for with timing is that all cylinders are running the same amount of timing, within a small tolerance, and that you have no wild fluctuations during a long run like this one. As with several of the prior metrics, the huge fluctuations during a gear shift are expected and along with the ECU closing the throttle it will also 'pull' timing to reduce power during the gear shift operation. If you take a close look at my graph you can see the timing measurement actually goes negative during a gear change, meaning the ECU is firing the spark after TDC at the end of the compression stroke. The result of starting combustion so late is that more of the combustion will happen when the exhaust valve is open, reducing power through the crank, but still keeping the turbo spinning fast because combustion is still taking place. This is what gives that fantastic burble sound that automatic cars have when they shift up a gear under hard acceleration! If I overlay the revs again, you can see the timing fluctuations happen in line with the revs dropping for a gear shift operation so there's nothing to worry about with the timing overall.
Towards the end of the graph though, there is something to note here and it's that cylinder 1 and cylinder 2 are starting to run less advanced timing than the other 4 cylinders. Take a look here:
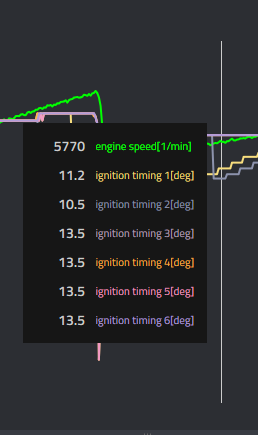
This is well outside of my tolerance for timing variation between cylinders and I did investigate this to identify the cause. Fortunately, this wasn't anything to be too worried about it turns out it was a result of my methanol injection system mentioned in Part 11. Because the methanol injection system is injecting a fine mist of methanol into the intake, if you inject too much then not all of it will evaporate and liquid methanol can pass through the intake manifold and enter the cylinders through the intake valves. This isn't necessarily an issue but because liquid methanol isn't as light as the evaporated methanol, it isn't evenly distributed between the cylinders. My engine is a longitudinally mounted, 6 cylinder engine, meaning cylinder 1 is closest to you when you're stood at the front looking at it and cylinder 6 is further away, with them all being in a straight line. When the car is hurtling forwards the liquid methanol wants to run towards the back cylinders whilst inside the intake manifold, meaning the front cylinders (1 & 2) get less of it. Methanol is a high octane fuel that allows you to run more timing, so with less methanol, you run less timing! My ECU was detecting this variation and adjusting the timing on a per-cylinder basis, on the fly, to compensate, which is outrageously awesome! With the flow rate of my methanol injection system altered I was able to bring all of the cylinders into perfect alignment on their timing and this is a great example of catching something before it even becomes a problem.
Knock, Knock, BOOM!
Partially joking and partially serious, knock is bad. As mentioned above in the ignition timing section, you can get knock for a variety of reasons but you never, ever want knock. Here is my knock graph, and the knock graph that you always want.

That's a big, flat line right across the graph reading 0 the whole time. During the entire time I was logging, the ECU detected o instances of knock. If you're experiencing knock you need to stop pushing the car hard and potentially even stop driving it if you're getting knock all the time without placing the engine under load. Sometimes you will only know you have knock by looking at logs like this but sometimes you will actually hear it too. It sounds like a metallic rattling sound almost and knock is sometimes calling 'pinging' as it sounds like metallic parts pinging together. Hopefully we can all appreciate that driving your car while it's making weird sounds is possibly not the best idea!
As I said earlier, common causes for knock are running too much timing, things are running too hot or you have fuel that isn't good enough quality or isn't a high enough octane rating. You can usually attribute the cause quite easily, for example if the knock happens once you get to a certain timing advance or temperature, or you recently put some new fuel in and you're suddenly getting knock where you didn't have it before. Either way, if you're reliably seeing knock, stop what you're doing and fix it, unless you want to risk serious damage!
Other things to monitor
When monitoring your engine and taking a data log, there's a whole heap more stuff you can record from a modern ECU. In my typical data logs I'm only recording 30-35 data channels but my ECU exposes a total of 703(!) that can be actively monitored and recorded. The ones that I typically log cover the basics and give me a wide enough range of data to look at to identify general problems before they become big problems. If you're diving in and really investigating a particular issue then many of those additional data channels are going to be useful.
How to do a data log
Whenever I make a change to my car, be it flashing on a new tune or installing a new piece of hardware, I always do a few runs with data logging to make sure that everything is running as expected. You can't really do a proper run for data logging on a public road here in the UK because you're going to be exceeding any possible speed limit before you really get a chance to push the car hard so there are generally 2 options. The data log we've been looking at in this post was taken by me on a runway at an airport which is a perfect place to really take a car for a blast because you have ~2 miles (~3.2Km) of flat, straight tarmac!
Once I've removed the speed limiter at 175mph I'm planning to return to Elvington and see if I can crack 200mph (322kph)! The other option you have is to strap the car down on a dyno (dynamometer). Known as a 'rolling road', this is exactly what it sounds like and is a set of rollers in the floor that you strap your car to and let it rip! With a dyno you sometimes see slightly different temperature behaviour because fans can't often fully replace natural airflow at 100mph+ but you can load up the engine with brakes on the dyno that simulate real load and mean you can get a good data log.
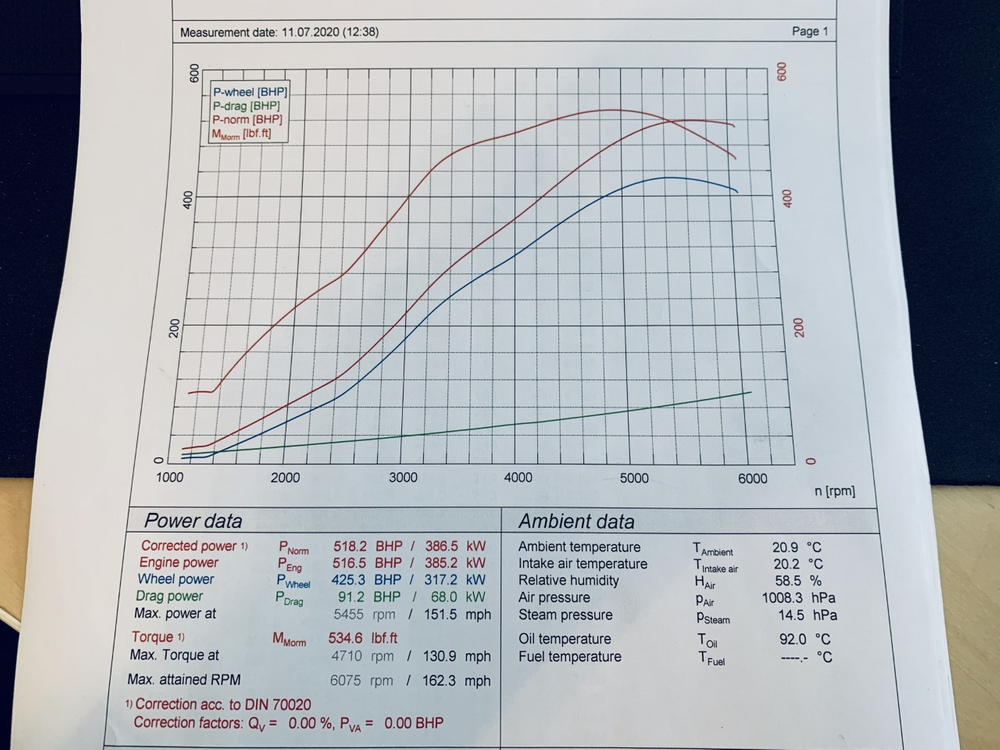
People most often strap a car on a dyno to do a 'power run' which allows the dyno to get an accurate reading of the power output of the car and you will get a graph that looks like this. This is a plot of the rpm of the engine on the x-axis against the power and torque output on the y-axis.
Sometimes though, people like to strap their car on a dyno just for fun! A garage near me does 'dyno days' where you can pay as little as £30 to have your car strapped down and to let it rip for a few back-to-back runs. This means you can do some data logs, get some power runs printed out and just meet likeminded people or check out other cars in attendance. Back in my office days when I was doing ~36,000 miles per year commuting, I bought a cheap Nissan Leaf EV to save on fuel costs and cover and bunch of miles with electricity instead. I took my Leaf to one of the dyno days, just purely for the fun of it, and back in 2014 our local shop did its first ever dyno run with an electric car!
This can be a really cheap way to get some great data logs from your engine without risking serious legal repercussions trying to do this on a public road! If you're a member of any car forums or groups, you'll often find that people are happy to review your logs if you post a link to them on something like DataZap too, I know I've often read through a log to give some feedback to fellow car enthusiasts so don't be worried about asking for help with your logs either 👍
View all of the other blog posts here: The BMW M140i Project Series