
As the number of servers you manage increases, keeping an eye on them all can become a bit of a task in itself. I've used Munin for quite some time but I was looking to change it out for something that was a bit easier to manage once https://report-uri.io came along. That's when I came across New Relic. Here's how to get started on monitoring the health of your servers and applications.
Why monitor at all?
One of the biggest reasons to monitor the health of your servers or applications is to spot a problem before it becomes a problem. Maybe your average CPU utilisation is creeping up or the amount of spare RAM your system has is dropping. Over time, these things will become a problem, but everything could seem perfectly fine right now. The same goes for your applications. Is your application response time suffering or do you have an increased error rate? Armed with more data we can better evaluate how our systems are performing and better analyse what happened when they don't perform.
Ubuntu - Server Health
Monitoring the health of your server allows you to quickly and easily capture some of the core metrics that you should be looking out for. CPU Usage, RAM Usage, Disk I/O, Network I/O and load. You can then drill down even further and look at more details like all of the running processes, which ones are using up the most resources, bandwidth at the network interface and much, much more. For now, let's look at how we get setup. I think it goes without saying that you need an account over at New Relic and you can use the following instructions to get started by monitoring your Ubuntu server.
Setup
Add the New Relic repository:
sudo sh -c 'echo deb http://apt.newrelic.com/debian/ newrelic non-free >> /etc/apt/sources.list.d/newrelic.list'
Add the New Relic key to trust their packages:
wget -O- https://download.newrelic.com/548C16BF.gpg | sudo apt-key add -
Update your package list and then install the New Relic System Monitor Daemon:
sudo apt-get update
sudo apt-get install newrelic-sysmond
Configure the deamon to use your license key (found under Account Settings):
sudo nrsysmond-config --set license_key=YOUR_LICENSE_KEY
You can also manually edit the config file to insert your license key or change it if needed:
sudo nano /etc/newrelic/nrsysmond.cfg
We're all set, fire up the service:
sudo service newrelic-sysmond start
Overview
Once the service is running, it should only take a minute or two for data to start appearing in your dashboard. The server will show up in the Servers section and be identified by its hostname.
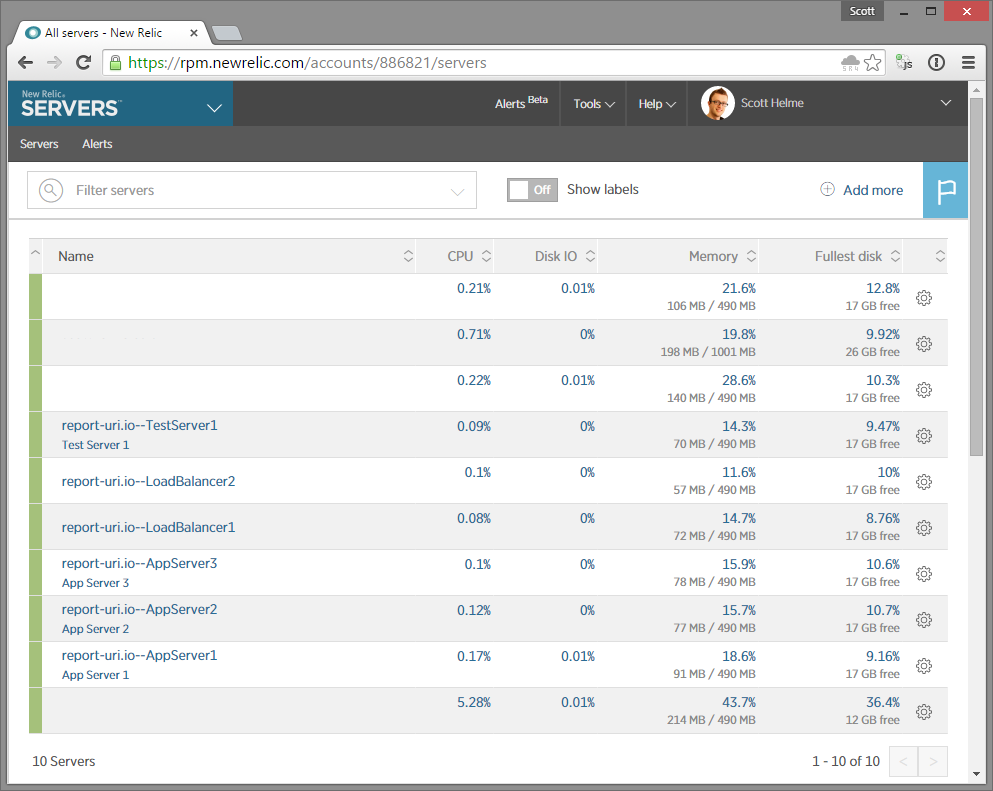
From here, if you select the server name, it will take you to more detailed information about that particular server and this is where we start to get some really awesome data.
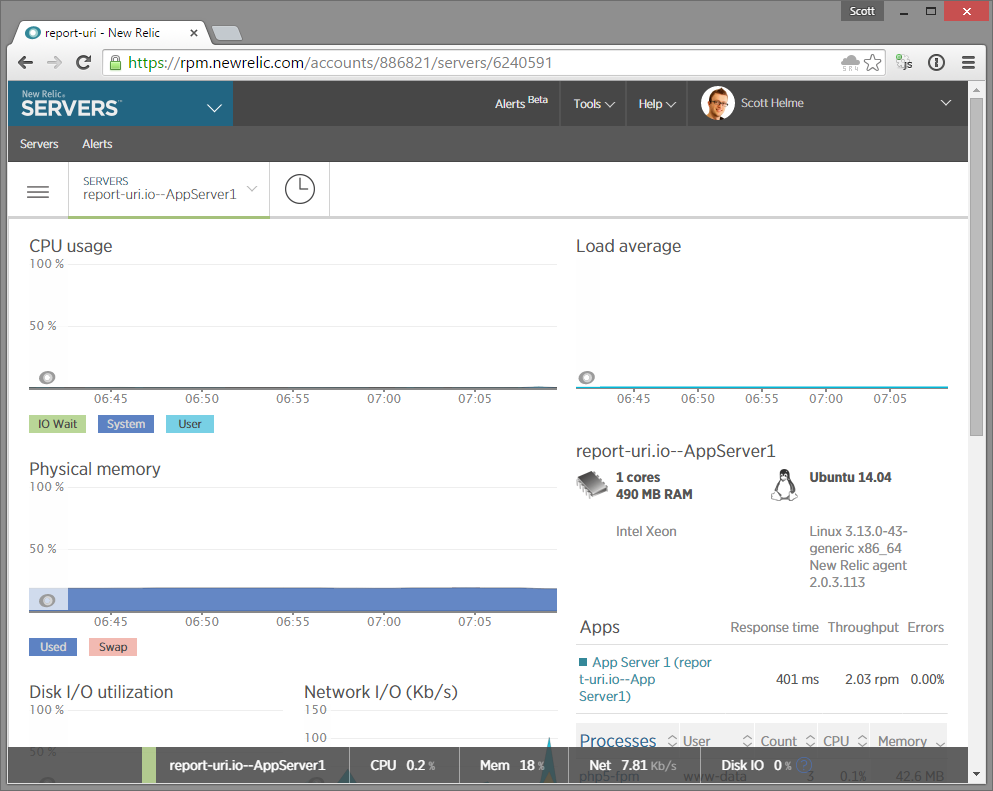
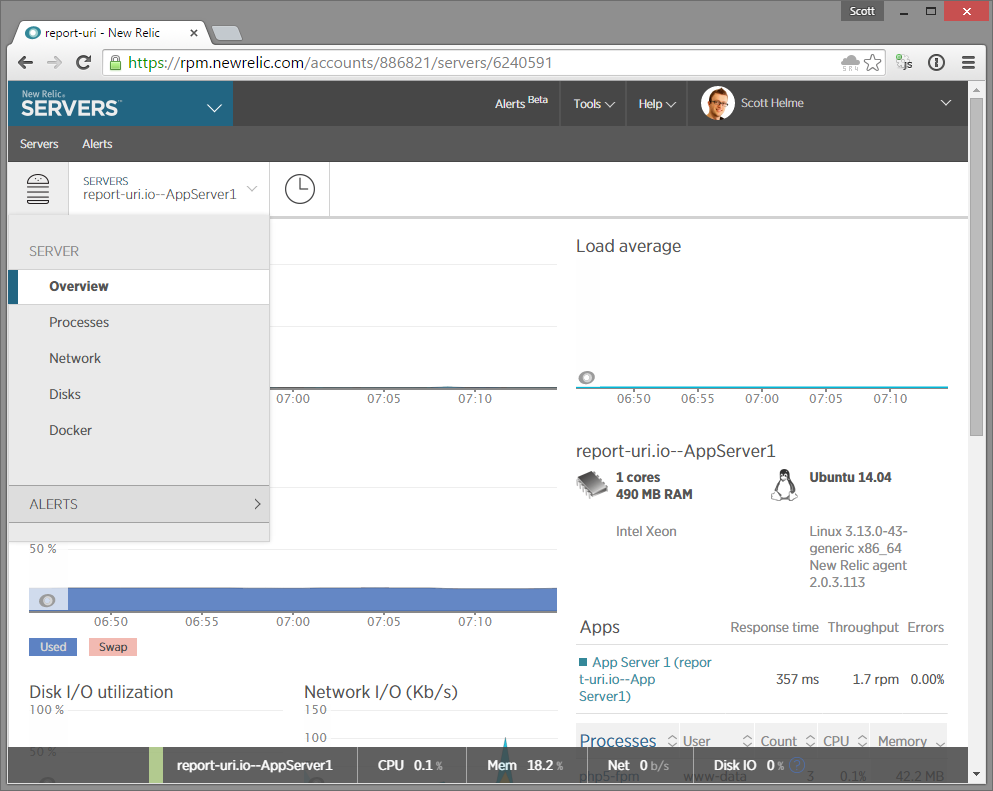
The overview page gives you high level information on all of the core statistics. At a glance we have great graphs giving us information on CPU and RAM usage, disk utilisation and network I/O and our average load on the server itself. Tracking trends in these graphs alone over time could help to identify upcoming problems like a lack of resources or misconfigurations on the server itself. Using the menu on the left we can drill down into some more detailed information on various aspects of the server.
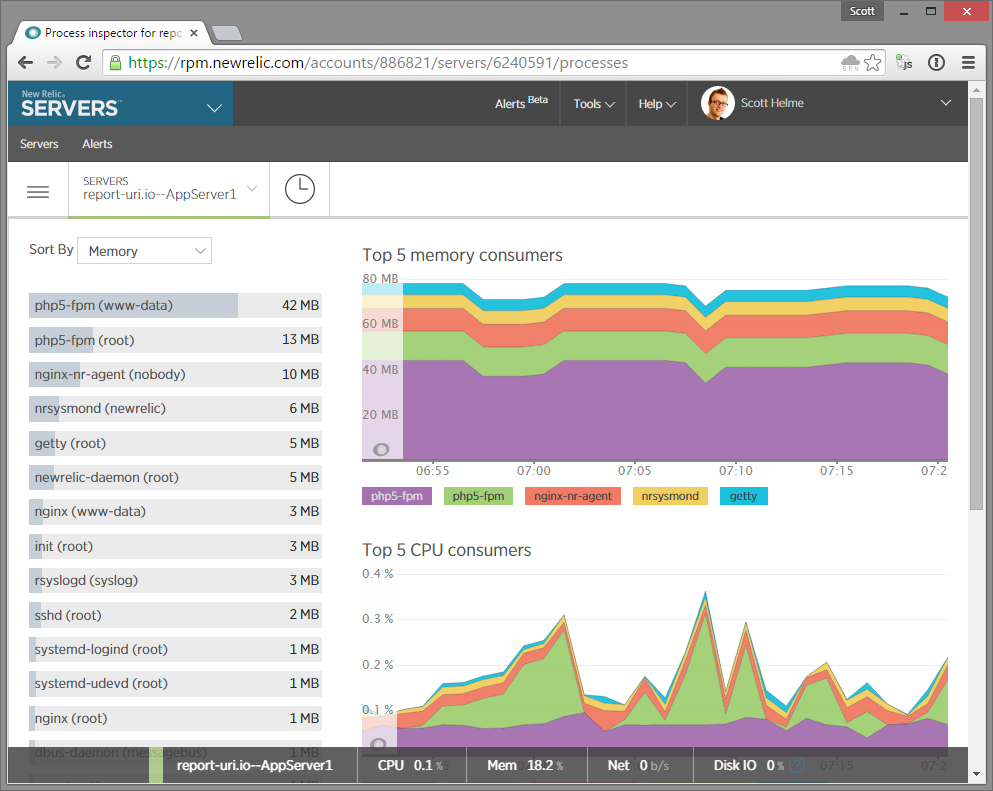
Processes
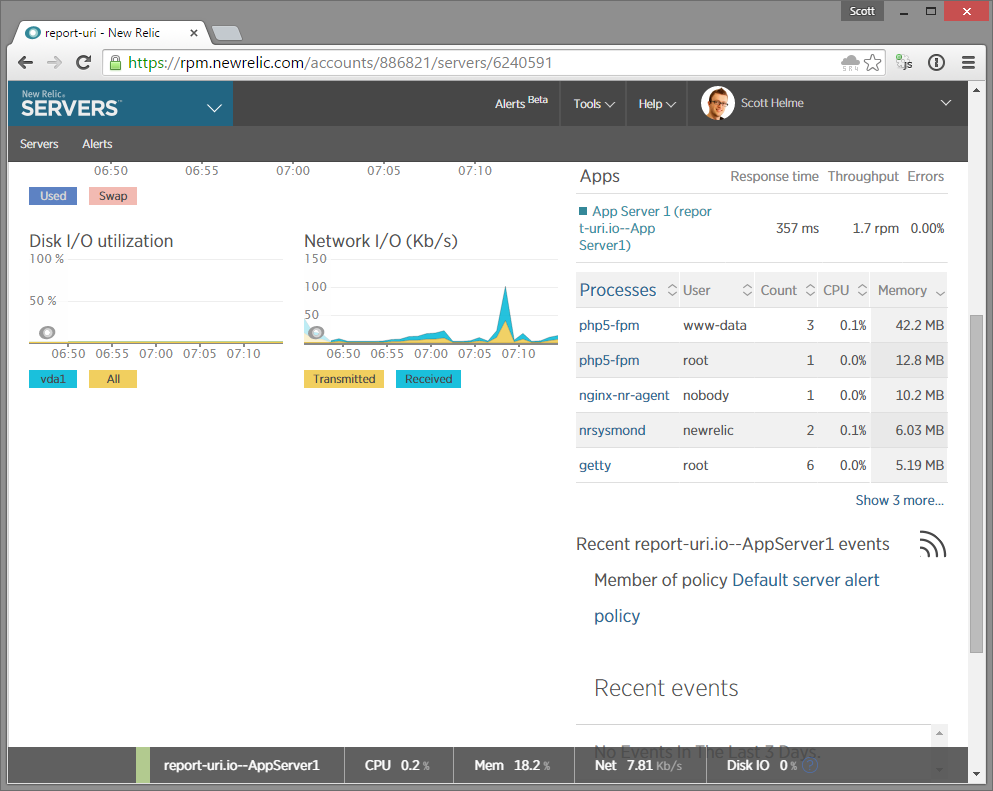
In the processes section you can see every running process on the server, the user the process is running as and the amount of CPU and RAM resources it is consuming. This is great for diagnosing issues if your system is short on resources and you want to know where they are all going.
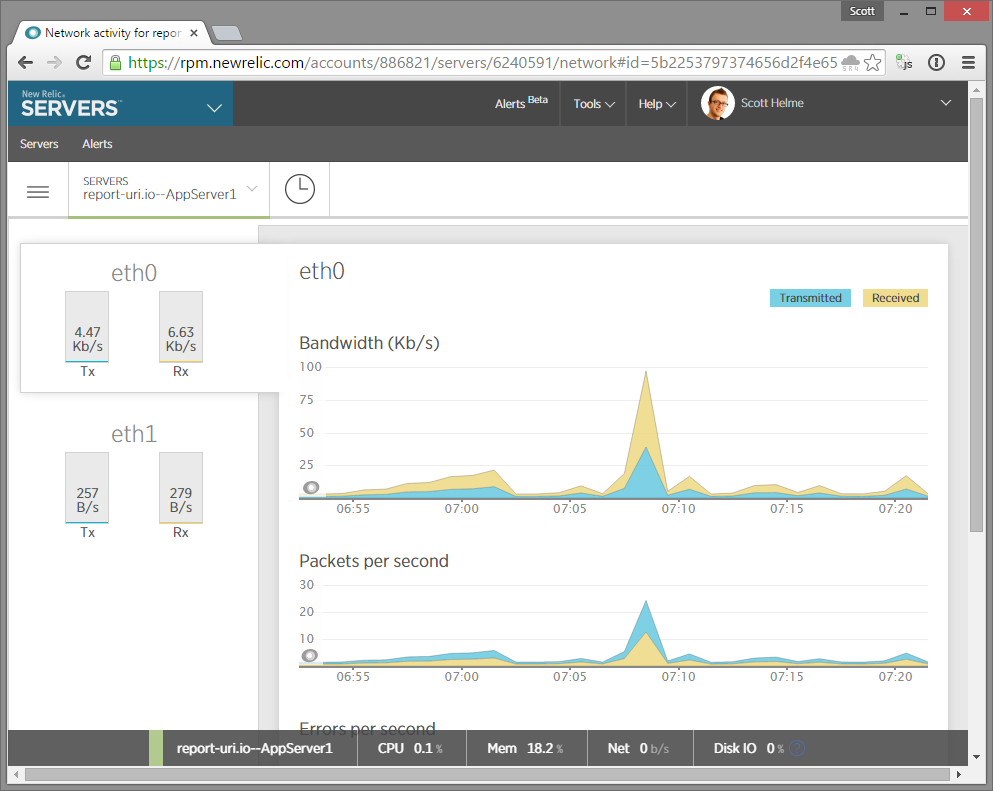
Network
The network menu allows you to keep track of you inbound and outbound traffic, the number of packets coming in out and out of your server and how many errors you're seeing at the network interface. It's great to see if you're hitting a bottleneck at the network interface or to account for a high error rate due to packet loss.
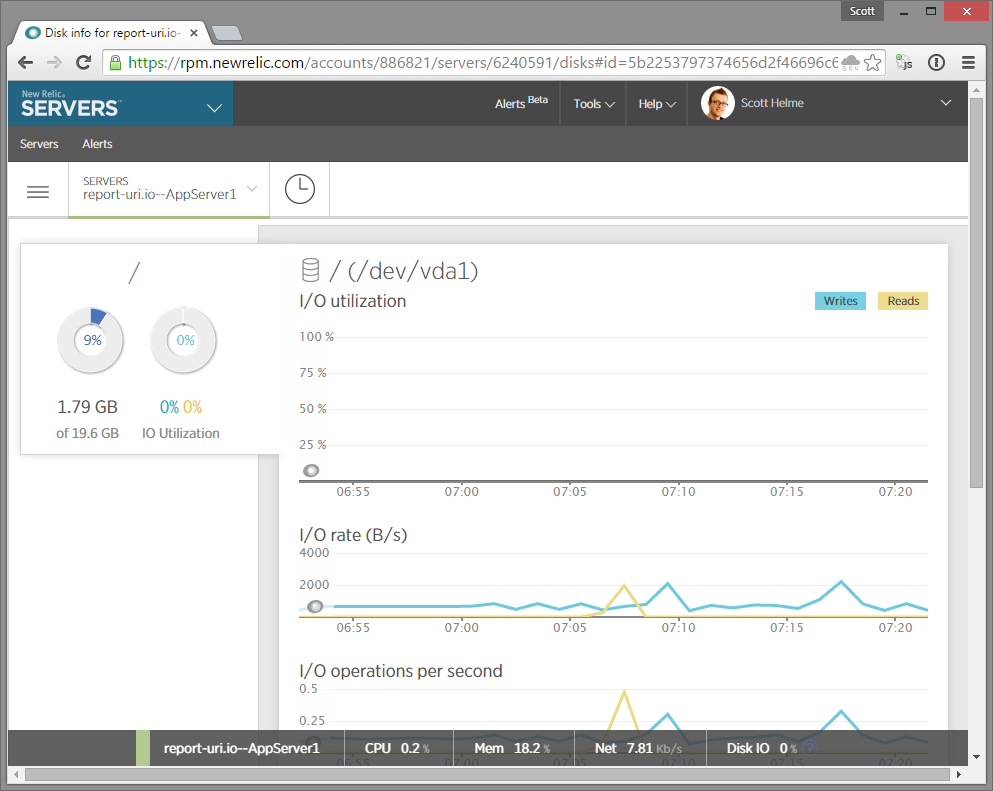
Disk
Another common cause for problems on a server is the storage drive. Here you can keep track of total space used/available, the I/O utilisation, the I/O rate in KB/s and importatly the number of I/O operations per second (IOPS). This can be a common cause for poor performance on a web server so being able to track metrics like these is crucial.
Monitoring Applications
Now that we have the basics setup with our OS being monitored, the next step is to see how our applications are actually performing. Whilst a lot of the time the application and OS will usually both display signs of an issue, it is perfectly possible for your OS to be in perfect health and your application to be dragging its feet along the floor, or, even completely dead! With the ability to monitor and report on a whole range of applications and platforms, New Relic should have you covered on this front too.
Node.JS monitoring
To get started I'm going to setup monitoring for the Node.js install that powers my blog. Setting up each application to be monitored is a really simple task and can provide swathes of useful information to diagnose performance and debug issues.
Setup
Change directory into your application folder and install New Relic:
cd /var/www/ghost
sudo npm install newrelic
Once installed we need to configure the module with the name of our application and license key:
sudo nano node_modules/newrelic/newrelic.js
Edit the following values:
app_name : ['Your App Name'],
license_key : 'Your License Key',
Once you've saved your changes, for Ghost, you need to copy the file into the root of your application folder:
cp node_modules/newrelic/newrelic.js newrelic.js
Then, edit the Ghost config to load the New Relic module
sudo nano index.js
You need to add the New Relic module:
var express,
    ghost,
    parentApp,
    errors,
    newrelic;
Then, make sure that the New Relic module is loaded first:
// Proceed with startup
newrelic = require('newrelic');
express = require('express');
ghost = require('./core');
errors = require('./core/server/errors');
Once we're all done, go ahead and restart your application to load up the new module:
sudo service ghost restart
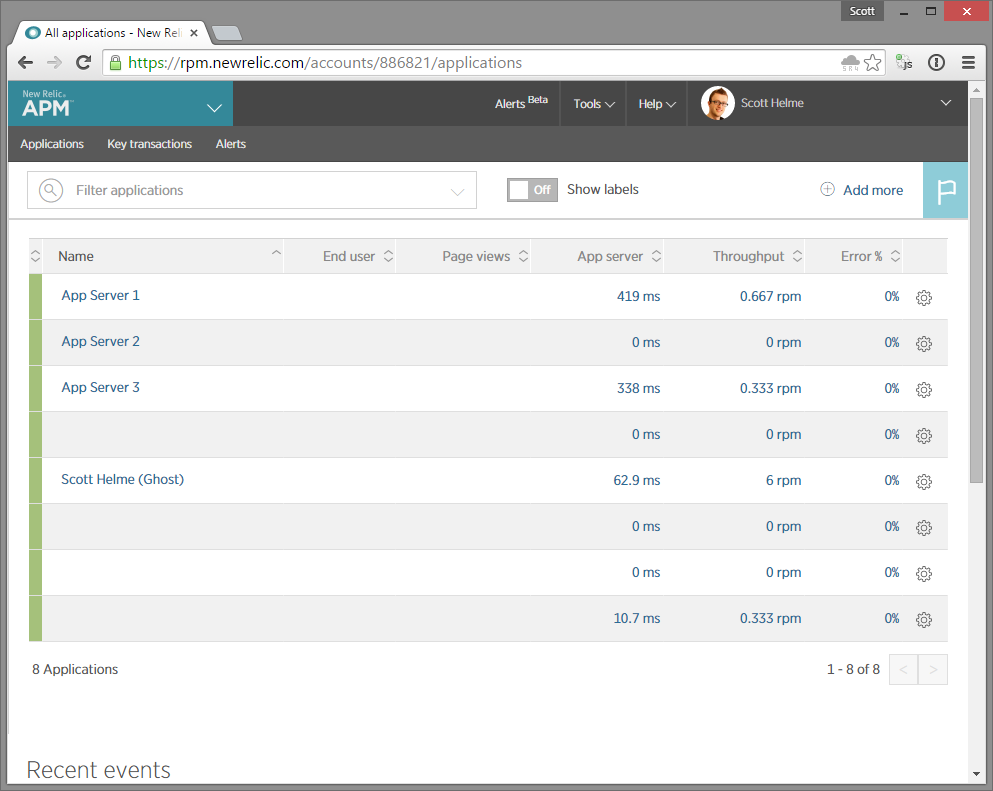
Overview
Just like before, it should only take a minute or two for the data to start showing up in the New Relic dashboard. Head over to the APM section and you should be able to see a list of any applications you have setup. Here you can see my Ghost application called "Scott Helme (Ghost)".
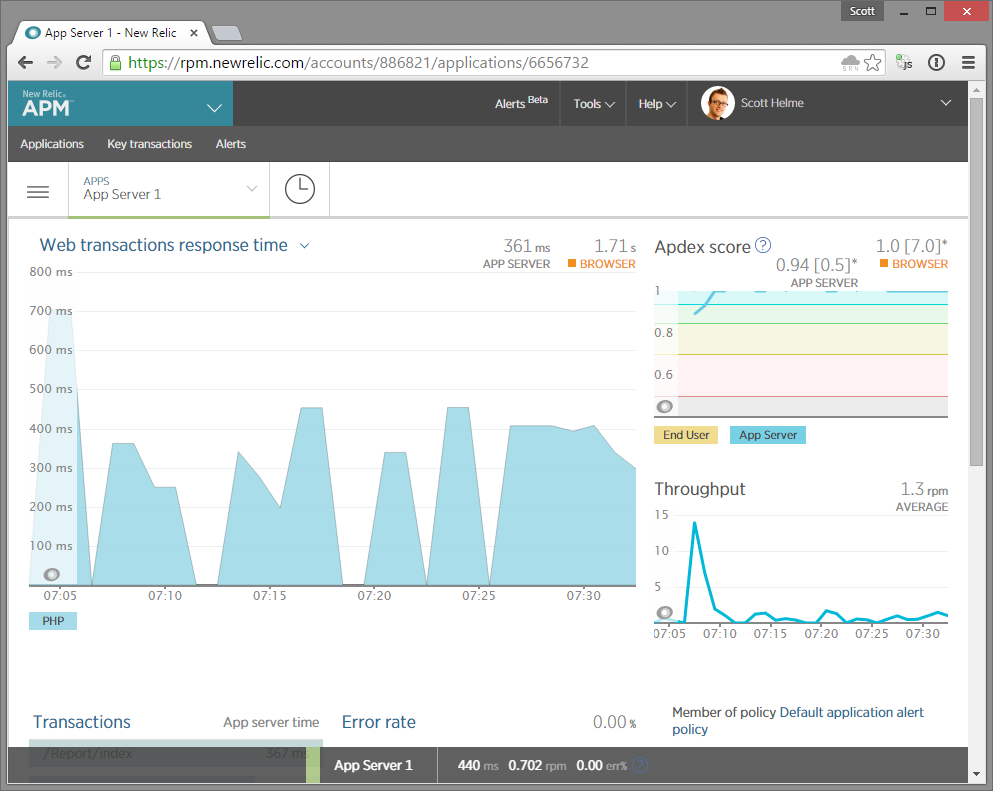
Selecting the application will take you to the Overview.
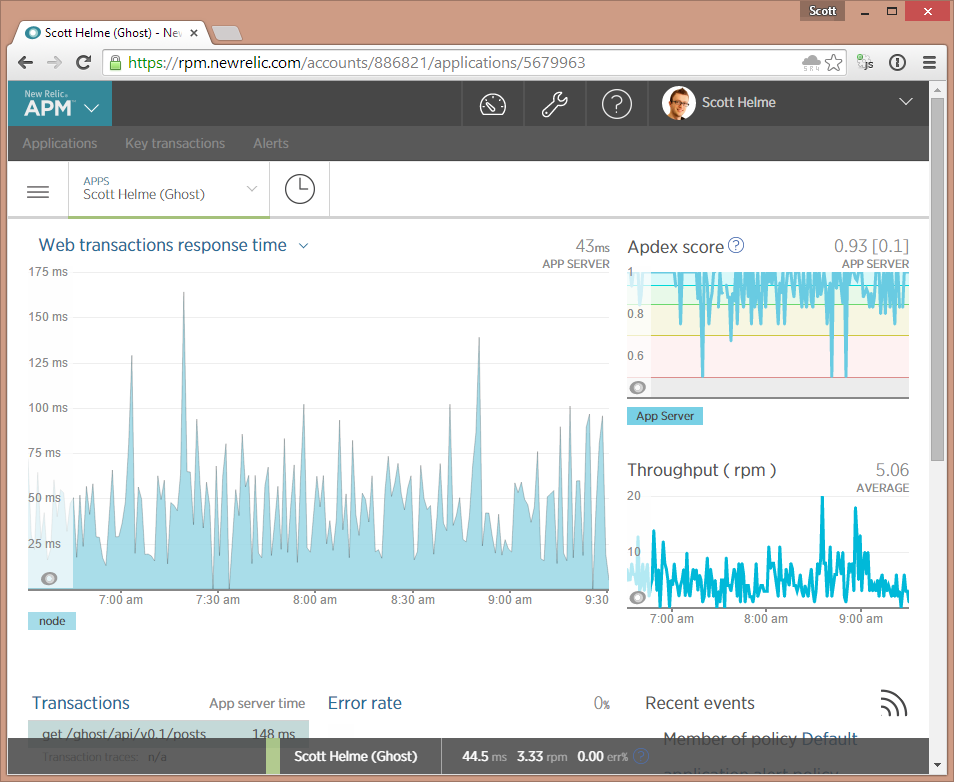
Right away we're seeing a few important metrics being graphed for us. The response time of the application to requests, our throughput of requests made to the application and the Apdex score. The Apdex score is defined as "an industry standard to measure users' satisfaction with the response time of an application or service". In essence, it's a simplified SLA and can tell you, as the site owner, how good the user experience is for visistors to your site. This is the kind of information that you just don't have access to without a robust monitoring solution in place. Now, there are way too many sections to go through, so I'm just going to cover the best one!
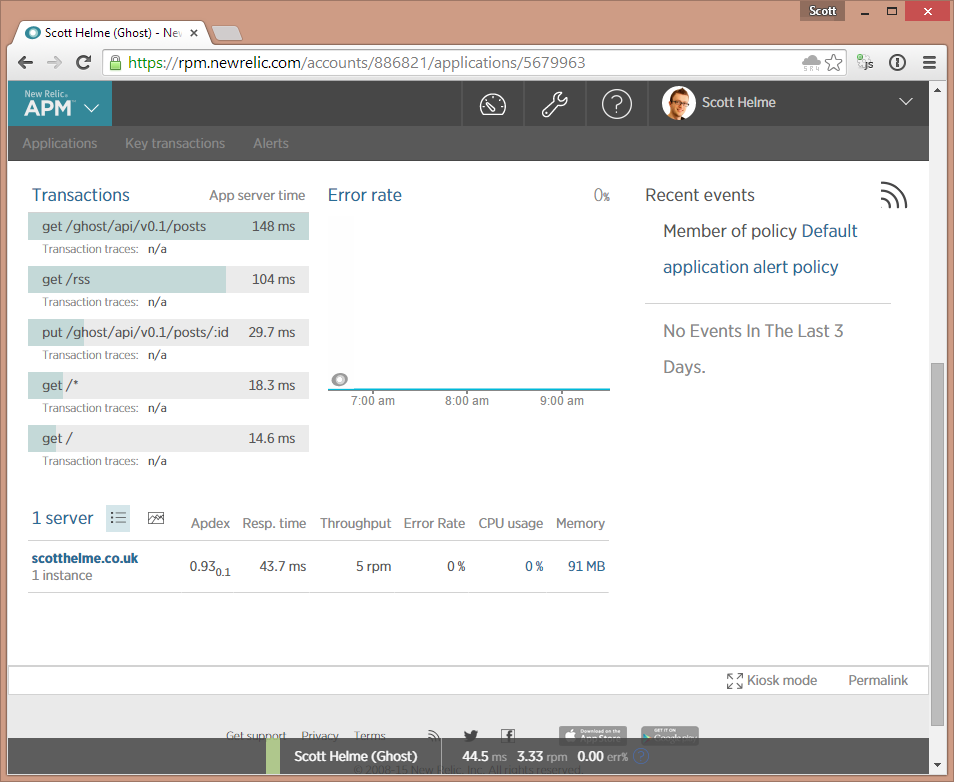
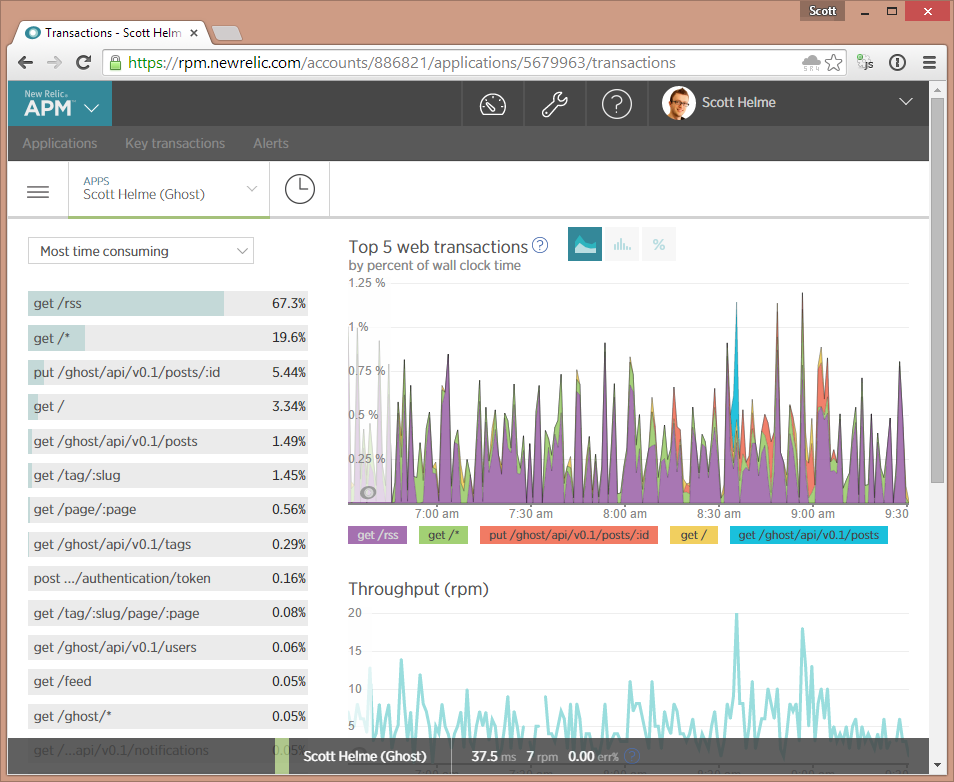
Transactions
The transactions section allows you to see information on your most time consuming, slowest response time, Apdex most disatisfying and highest throughput transactions. If you want to try and increase the performance of your application, these are the worst offenders that you need to take a look at improving.
NginX Monitoring
The next thing up on the monitoring list is your HTTP server, in my case, NginX. Although all NginX does is proxy requests through to Node on the backend for me, it's still useful to see exactly what's going on. Not all requests will be passed to Node as NginX takes care of cahcing a lot of assets for you and hey, more information is better than less!
Setup
First you need to grab your release codename which you can find with the following command:
cat /etc/lsb-release
Then you need to add the NginX repositories to install the New Relic plugin. Replace codename with your actual release codename in the following 2 commands.
sudo sh -c 'echo deb http://nginx.org/packages/mainline/ubuntu/ codename nginx >> /etc/apt/sources.list.d/nginx.list'
sudo sh -c 'echo deb-src http://nginx.org/packages/mainline/ubuntu/ codename nginx >> /etc/apt/sources.list.d/nginx.list'
Grab the NginX GPG key and add it to the list of trusted keys:
wget -O- http://nginx.org/keys/nginx_signing.key | sudo apt-key add -
After that, update your package lists and install the NginX New Relic Agent:
sudo apt-get update
sudo apt-get install nginx-nr-agent
Once installed, you need to configure the agent with your license key. Edit the file and insert your license key and the NginX Status page:
sudo nano /etc/nginx-nr-agent/nginx-nr-agent.ini
You need to change the following to insert your license key:
newrelic_license_key=YOUR_LICENSE_KEY_HERE
Then you need to update the location of your NginX status stub. Change the source from this:
#[source1]
#name=exampleorg
#url=http://example.org/status
To something suitable such as this:
#[source1]
name=scotthelme.co.uk
url=https://scotthelme.co.uk/nginx_status
Now that we've configured where the agent will look for the NginX status page, we need to set it up in NginX. Edit your appropriate virtual host file:
sudo nano /etc/nginx/sites-available/scotthelme.co.uk.conf
Then add a location block for the status page:
location /nginx_status {
    stub_status on;
    access_log off;
    allow 127.0.0.1;
    deny all;
}
Once we're all set, you just need to restart NginX and the New Relic Agent:
sudo service nginx restart
sudo service nginx-nr-agent start
Overview
Jumping back over to the New Relic dashboard, you need to head to the Plugin section and there you should see a new entry for your NginX Web Server plugin.
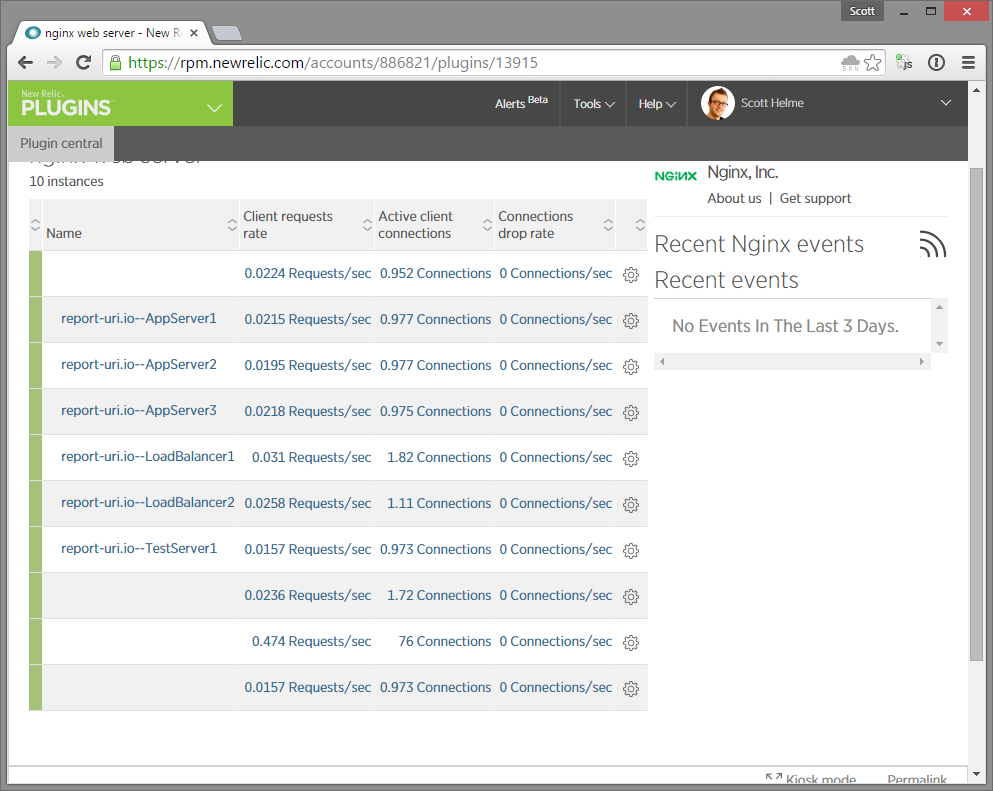
There's some useful inforation right here at a high level, but clicking into the server, we get the usual handy graphs that we've come to expect.
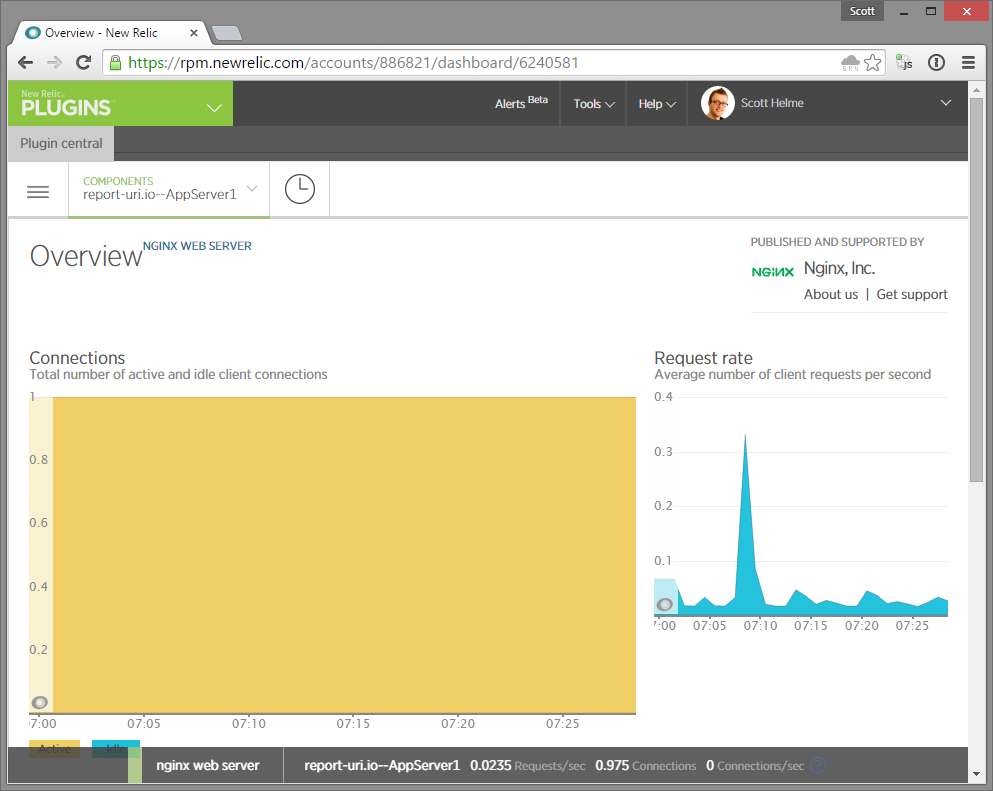
Keeping an eye on your Request rate will help identify sudden surges in traffic and the number of active Connections is also another common bottleneck to keep an eye on. Any unexpected jumps in either of these graphs could be an early indication of upcoming performance issues or maybe even that you're under attack.
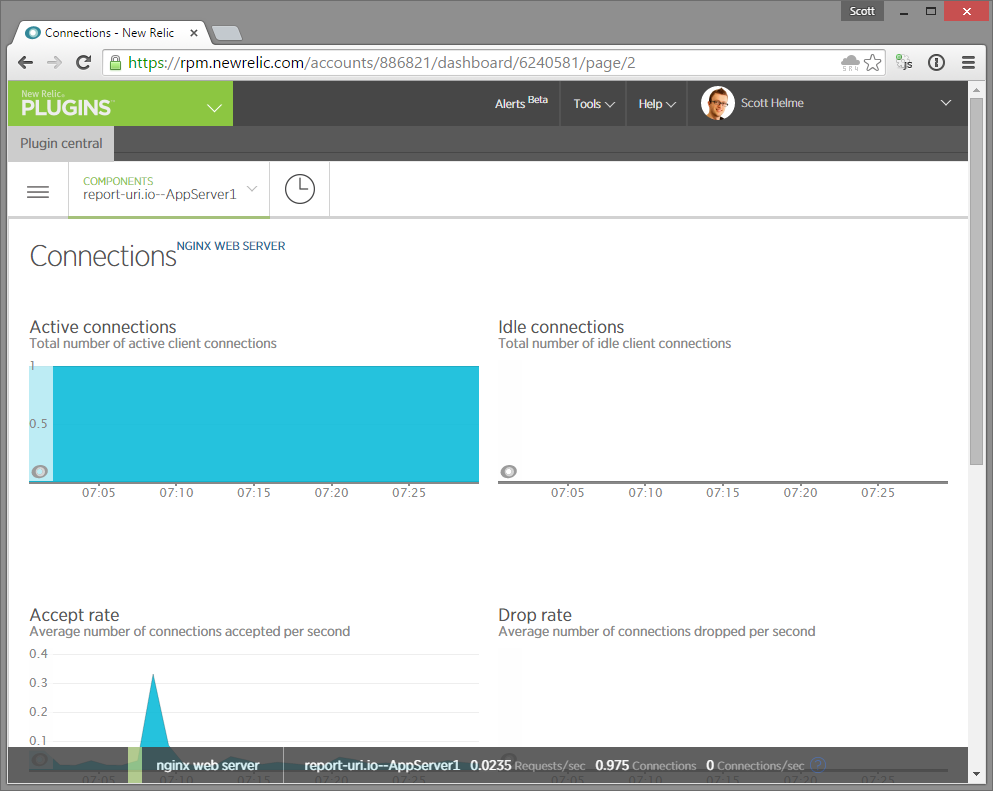
Connections
The Connections section really just gives us a little more detail on the number of Active/Idle connections, the rate at which you accept new incoming connections and the rate at which you're dropping connections. Another metric that's useful in diagnosing issues with your site.
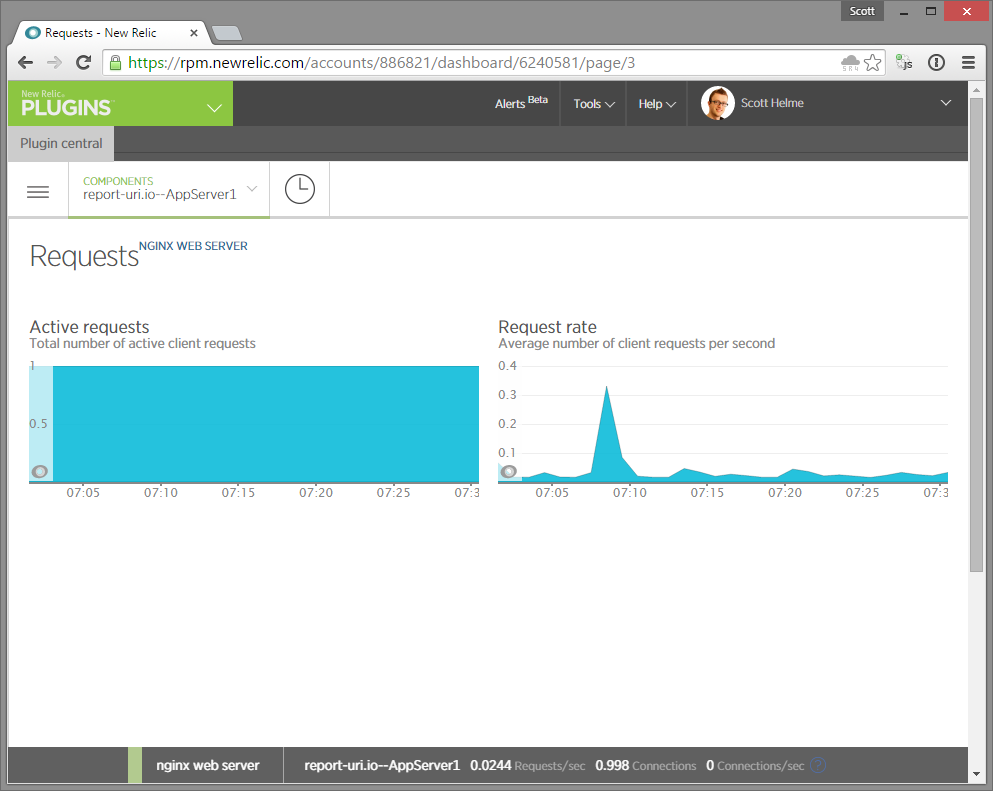
Requests
Again, the Requests page gives us access to a little more detail than the overview page and we can see the number of active client requests the server is catering for and the number of incoming requests per second being made against the server.
PHP monitoring
Jumping over to one of my other servers now, I wanted to take a look at just how easy it was to setup monitoring for a PHP application. As it turns out, that's pretty easy going too!
Setup
If you haven't already added the New Relic repository in the previous section on monitoring an Ubuntu server, you will need to add it now:
sudo sh -c 'echo "deb http://apt.newrelic.com/debian/ newrelic non-free" > /etc/apt/sources.list.d/newrelic.list
Next you need to trust the New Relic GPG key:
wget -O - https://download.newrelic.com/548C16BF.gpg | sudo apt-key add -
Update your package list, install the New Relic PHP deamon and then configure it:
sudo apt-get update
sudo apt-get install newrelic-php5
sudo newrelic-install install
When prompted, fill out the name of your application and your New Relic License key:
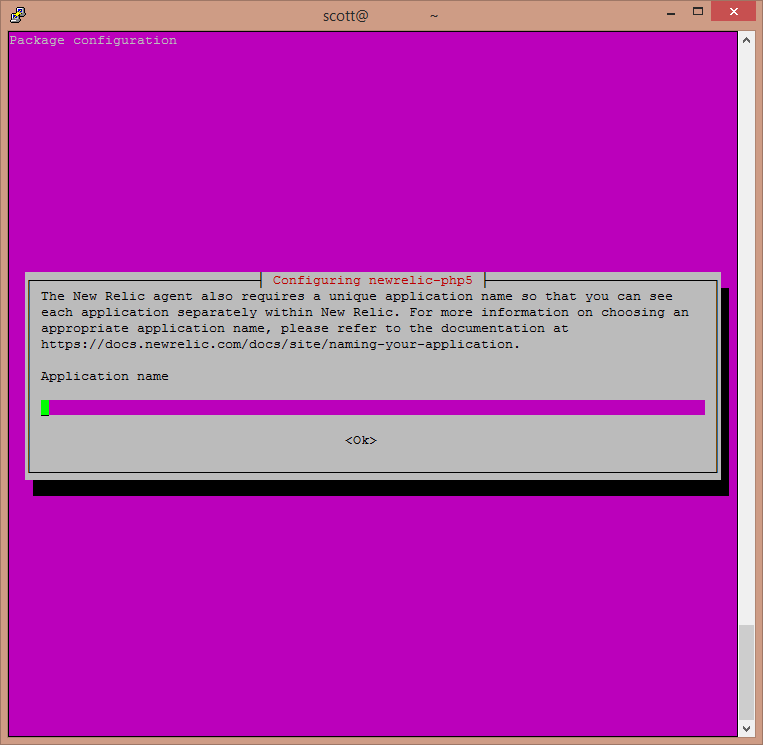
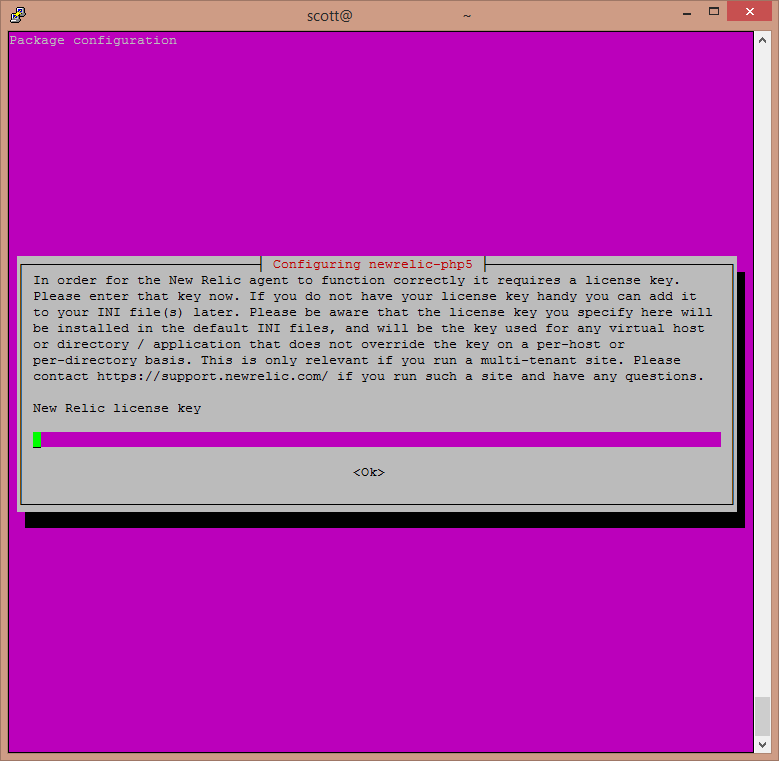
Once it's all configured you just need to restart PHP and your web server:
sudo service php5-fpm restart
sudo service nginx restart
Overview
If you have any existing applications being monitored by New Relic, you should just see your new PHP application pop up alongside them in the APM section. Select your new application to get started.
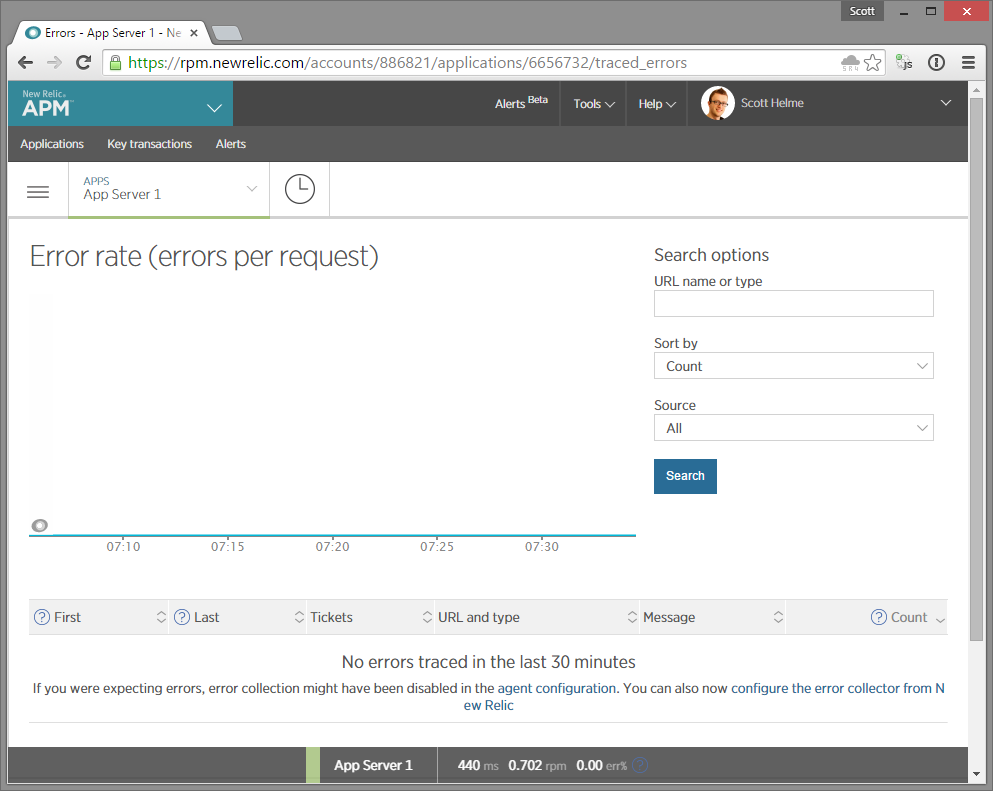
Errors
Similar to the Node.js monitoring, the PHP monitoring provides you access to a Transactions overview but you also get an Error section that provides details on the error rate of your application.
Conclusion
New Relic offer all of the above on their free accounts. The monitoring is near real time and their dashboards are simple and easy to use. You can get access to a wealth of information about the current state of your servers and their applications to help you better manage them. If you don't have any monitoring setup I'd suggest taking a look at New Relic and what they can offer.