
This blog post is going to detail what was a pretty lengthy journey for me in debugging an elusive issue that started to occur on Report URI recently! It required me to investigate and learn about things that were outside of my area of expertise, created heaps of frustration and ultimately, of course, turned out to be my fault... 😅

Report URI
I'm sure that many regular readers will be familiar with Report URI, the security monitoring and alerting platform that I founded and operate. Well, recently, I started to observe a sporadic issue that took me a little time to nail down. First, a little on our infrastructure to set the scene.
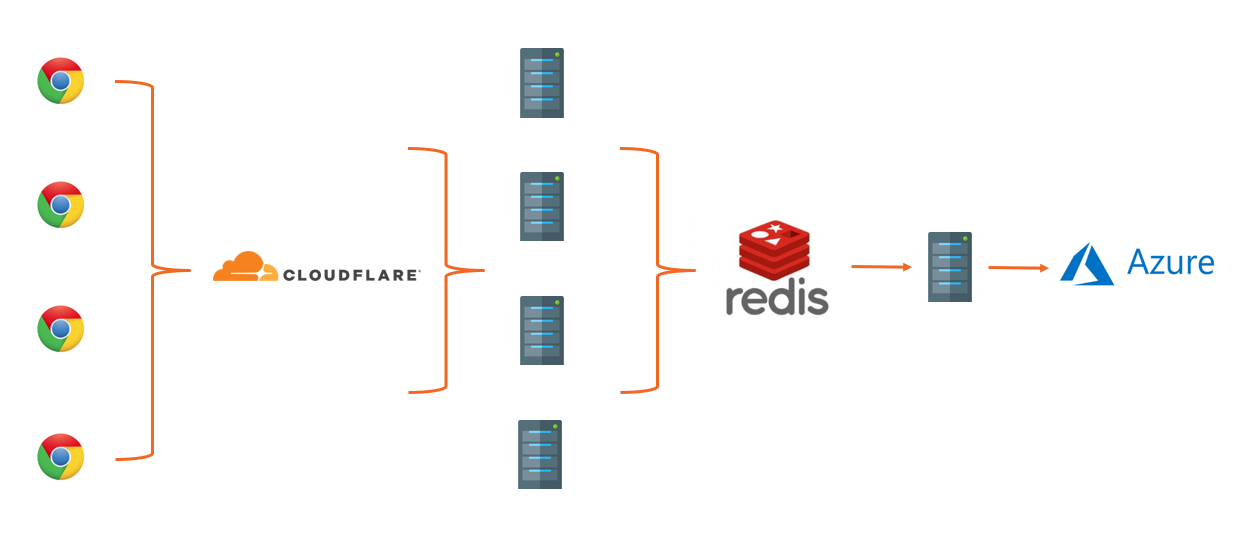
- Data is sent by web browsers as a POST request with a JSON payload.
- Requests pass through our Cloudflare Worker which aggregates the JSON payloads from many requests, returning a 201 to the client.
- Aggregated JSON payloads are dispatched to our origin 'ingestion' servers on a short time interval.
- The ingestion servers process the reports into Redis.
- The 'consumer' servers take batches of reports from Redis, applying advanced filters, threat intelligence, quota restrictions and per-user settings, before placing them into persistent storage in Azure.
The problem was occurring on our ingestion servers when we attempted to parse the JSON payload in the POST requests sent to our origin.
JsonException #3
The problem started with log entries of an exception coming from our ingestion servers. It seems fairly innocuous and, apparently, we were getting some invalid JSON payloads.
Nette\Utils\JsonException #3
Control character error, possibly incorrectly encoded
After inspecting the POST payload in the exception log, it was indeed truncated, causing the Json:decode() to throw an exception.
I was concerned that the exception log may be truncating the POST payload, as indicated at the end of the line, so I enabled some additional logging when handling the JsonException to log the value of the content_length header ($_SERVER['CONTENT_LENGTH']) and the size of the raw POST body that PHP is seeing (strlen(file_get_contents('php://input'))). Here are the results.
[2023-09-02 17-54-26] Problem parsing JSON, content length: 261671
[2023-09-02 17-54-26] Post size was: 65536
[2023-09-02 17-54-27] Problem parsing JSON, content length: 236481
[2023-09-02 17-54-27] Post size was: 65536
[2023-09-02 17-54-27] Problem parsing JSON, content length: 237498
[2023-09-02 17-54-27] Post size was: 65536
It does seem that the declared content length is much larger than what PHP is receiving, and it's not a misleading exception because of truncation in the exception logging, we are actually seeing a truncated payload. It's also interesting to note that the request body is always truncated at 65,536 bytes regardless of how big the actual payload is.
Checking Nginx
My next step was to go upstream and add some additional logging to Nginx which is our web server / proxy in front of PHP-FPM. I wanted to see whether I could observe the same truncated payload behaviour between Nginx and PHP to narrow down where the issue was happening. Here's the Nginx log format I used.
log_format post '$time_local: req_len $request_length - con_len $http_content_length';This gave me the following log entries when I enabled logging on the ingestion servers.
02/Sep/2023:18:13:24 +0000: req_len 205 - con_len 453
02/Sep/2023:18:13:27 +0000: req_len 35266 - con_len 60944
02/Sep/2023:18:13:27 +0000: req_len 389327 - con_len 923803
02/Sep/2023:18:13:27 +0000: req_len 262352 - con_len 1355353
02/Sep/2023:18:13:27 +0000: req_len 207 - con_len 509168
I'm using the $request_length variable in Nginx which is the "request length (including request line, header, and request body)" and the $http_ variable which allows you to log out an "arbitrary request header field", such as $http_content_length. As you can see, the declared content length is again much larger than the actual request body received. There is always a slight discrepancy here as the $request_length includes the request line and headers, along with the body, and $http_content_length is only the body, but even factoring that in, the difference is significant.
Checking the Cloudflare Worker
At first glance, the logs above lead me to our Cloudflare logs which we collect via Log Push, but I was conscious that in this scenario it felt far more likely that I was at fault than them. Still though, I'd gone from PHP, to Nginx and now the next upstream step was to the Cloudflare Worker.
After trawling through our logs for the corresponding time that we were getting the JSON exceptions (which had stopped of their own accord after ~45 mins), I couldn't find anything that stood out other than Cloudflare receiving 500 errors from our origin, which was to be expected. Not finding anything particularly useful, it looked like Cloudflare was sending us the requests with a proper payload. I added some additional logging to our Worker so that if the issue were to return, we'd potentially have some extra information to work with.
Many of the issues I expected we might see should already be logged because Workers will log all uncaught exceptions, but it's easy to add some console.log() calls which will also be captured (source). I also added some additional request headers on requests to our origin so we could log those and compare metrics like the size of the payload before sending to the declared content-length and then the observed content-length.
  return {
    "X-Request-Body-Length": requestBodyLen.toString(),
    "X-Distinct-Reports":  distinctReports.toString(),
    "X-Total-Reports": totalReports.toString(),
  }
I then decided to do some more investigation across our origin servers to look for clues because I still wasn't sure what had happened.
CPU overload!
I took a look at our DigitalOcean dashboard to see how the ingestion servers were holding up during the window that the JSON exceptions were being thrown, and it seems that they were more than a little busy!
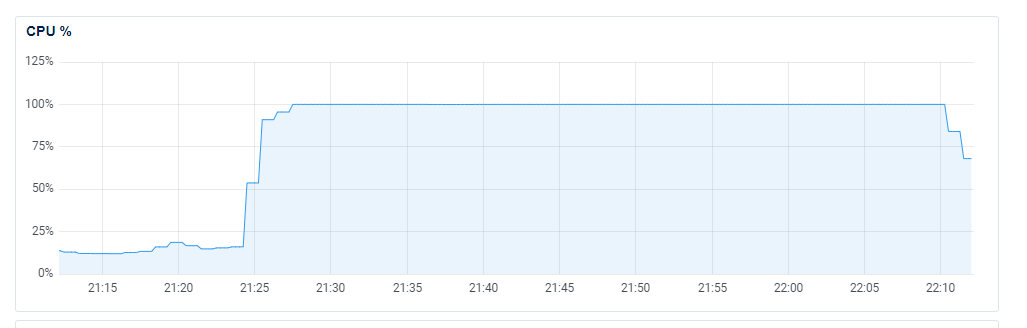
Yikes... This seemed odd because the JSON parse was failing, so I'd have assumed that they were doing significantly less than usual because the problematic inbound requests effectively leave them with nothing to do... During the same time window I could also see elevated Load, elevated RAM usage (but still plenty to spare), no noticeable disk activity (so we weren't paging) and no noticeable change in our ingress (so we didn't have a traffic spike). Our egress on the ingestion servers did display a drop, but that makes sense because there will be less traffic going to Redis if we're not processing as many reports. What on Earth is chewing up that much CPU?
Resource exhaustion
I was caught up on the CPU being slammed at 100% utilisation, especially when we weren't processing our usual volume of reports. After more research online and more debugging, I took a look at syslog and scrolled back to the time window of the issue and found the following entries.
Sep  2 20:22:14 report-ingestion-60 kernel: [12697.456786] TCP: out of memory -- consider tuning tcp_mem
Sep  2 20:22:14 report-ingestion-60 kernel: [12697.485758] TCP: out of memory -- consider tuning tcp_mem
Sep  2 20:22:14 report-ingestion-60 kernel: [12697.520596] TCP: out of memory -- consider tuning tcp_mem
Sep  2 20:22:14 report-ingestion-60 kernel: [12697.826360] TCP: out of memory -- consider tuning tcp_mem
Sep  2 20:22:14 report-ingestion-60 kernel: [12697.973408] TCP: out of memory -- consider tuning tcp_mem
Sep  2 20:22:14 report-ingestion-60 kernel: [12698.075398] TCP: out of memory -- consider tuning tcp_mem
Sep  2 20:22:14 report-ingestion-60 kernel: [12698.183949] TCP: out of memory -- consider tuning tcp_mem
Sep  2 20:22:15 report-ingestion-60 kernel: [12699.001482] TCP: out of memory -- consider tuning tcp_mem
Sep  2 20:22:15 report-ingestion-60 kernel: [12699.073934] TCP: out of memory -- consider tuning tcp_mem
Sep  2 20:22:15 report-ingestion-60 kernel: [12699.148919] TCP: out of memory -- consider tuning tcp_mem
Sep  2 20:22:19 report-ingestion-60 kernel: [12702.594396] net_ratelimit: 42 callbacks suppressed
Huh! This at least gave me something to work with so it was off to do some reading up on exactly what this error messages means, thinking of possible causes and investigating what a solution might look like.
TCP: out of memory -- consider tuning tcp_mem
We're delving outside of my area of expertise now, but I needed to identify the cause of the issue and put a solution in place so that it wouldn't happen again. I started off by looking at what tcp_mem is in the Linux manual and I got the following:
              This is a vector of 3 integers: [low, pressure, high].
              These bounds, measured in units of the system page size,
              are used by TCP to track its memory usage.  The defaults
              are calculated at boot time from the amount of available
              memory.  (TCP can only use low memory for this, which is
              limited to around 900 megabytes on 32-bit systems.  64-bit
              systems do not suffer this limitation.)

              low    TCP doesn't regulate its memory allocation when the
                     number of pages it has allocated globally is below
                     this number.

              pressure
                     When the amount of memory allocated by TCP exceeds
                     this number of pages, TCP moderates its memory
                     consumption.  This memory pressure state is exited
                     once the number of pages allocated falls below the
                     low mark.

              high   The maximum number of pages, globally, that TCP
                     will allocate.  This value overrides any other
                     limits imposed by the kernel.
This seems straightforward enough and the values are not something that I've looked at before. We use the vanilla Ubuntu 22.04 (LTS) x64 image from DigitalOcean when creating all of our servers, so the values would still be whatever the defaults were.
$cat /proc/sys/net/ipv4/tcp_mem
22302   29739   44604
Given that the unit of measurement here is units of system page size, we need that to calculate total size values.
$getconf PAGESIZE
4096
So, 4096 bytes per page gives us the following.
22302 pages x 4096 bytes = 91.348992 MB
29739 pages x 4096 bytes = 121.810944 MB
44604 pages x 4096 bytes = 182.697984 MB
I have no idea if these values are suitable or even if/how they should be tuned, so it was time for another venture down a rabbit hole of research!
After reading countless blog posts on the topic, I wasn't sure if I knew more or less than I did before... There seem to be countless ways to tackle the problem of tuning these values and people have different opinions on how to calculate the new values too. Another problem that I had was, even if I did tune them, I'd need to come up with a way to reproduce the issue to test the fix, and I didn't know what was actually causing the problem yet either.
What is using TCP resources?
Given that the problem revolves around resource exhaustion, specifically TCP memory resources, one solution could be to simply 'add more cloud'. Spreading the load over more servers should certainly help to reduce resource issues, but it's not the right solution. I took a look at what might be using TCP resources on these systems to see if that might point me to something.
- The Cloudflare Worker initiates TCP connections to our origin to send HTTPS requests.
- PHP connects to Redis using a TCP socket because the Redis Server sits on our private network.
That didn't seem like a particularly large amount of load but then, Michal Špaček (former Report URI staffer and someone I'd reached out to for help), asked me to check how Nginx was talking to PHP. Turns out we were still using the default configuration that has been there since the dawn of Report URI, and that was a TCP socket! So, now, our list of things putting pressure on TCP resources is.
- Cloudflare Worker --> TCP --> Ingestion Servers
- Nginx --> TCP --> PHP
- PHP --> TCP --> Redis
That seems like a really unnecessary overhead and one that's easy to remove. I switched PHP over to using a Unix Socket instead of a TCP Socket, deployed it on a canary server and waited to see if the change was good. Here's the config change that this needed along with a service reload for both Nginx and PHP-FPM.
nginx v-host config
- fastcgi_pass 127.0.0.1:9000;
+ fastcgi_pass unix:/run/php/php8.2-fpm.sock;

php-fpm config
- listen = 127.0.0.1:9000
+ listen = /run/php/php8.2-fpm.sock
The change seemed good with no adverse effects so I deployed it across the entire fleet, not just the ingestion servers. Everything is managed with Ansible so making changes like this across a large number of servers is really easy.
Then it happened again...
Shit... Having alleviated what should be approximately 1/3 of the load on TCP resources, I was surprised to see this happening again. I wanted to do some investigation while the problem was happening, and fortunately it happened while I was at my desk, so I dug in. I'd also deployed some better monitoring to the fleet in the form NetData Monitoring so that I'd have much more detailed information if the issue came back. (thanks for the suggestion João Poupino, who was now also involved in helping out!)
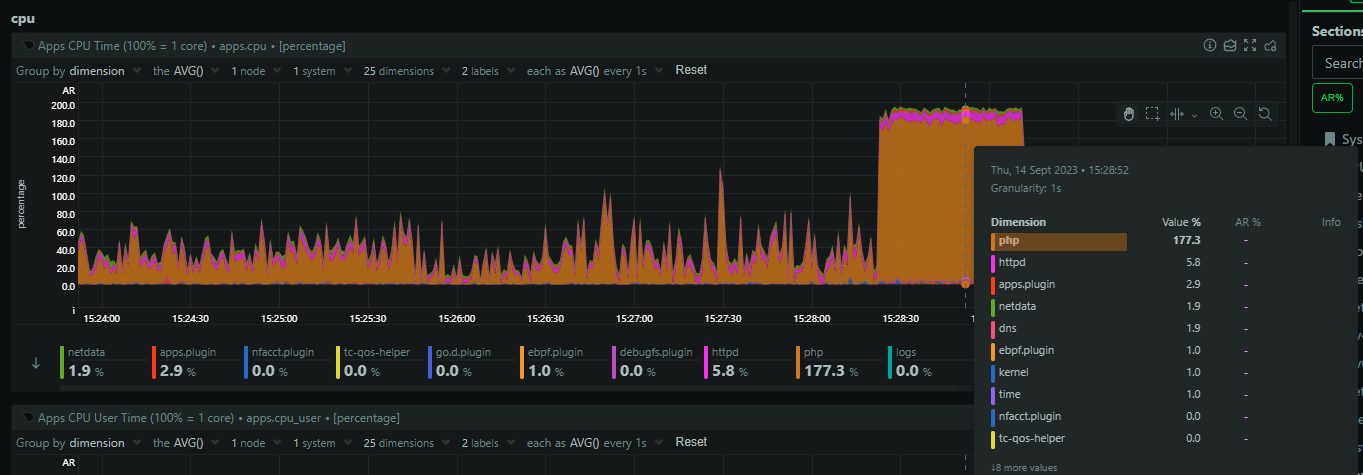
The issue was much shorter in duration this time, but I had a lot more logging and data ready to help me. It seems that PHP was chewing through all of the CPU resources on the servers.
There was also a huge spike in open sockets (file descriptors) coming from Nginx.
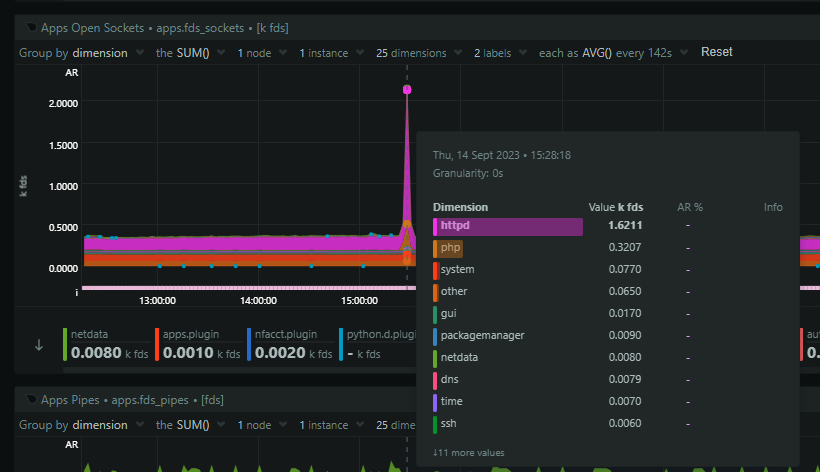
This means that Nginx is backlogging requests and that's likely because PHP is stalled out and I suspect we've hit pm.max_children = 64 which is what we use in production. The 64 PHP processes are busy, no more can spawn, and Nginx is just going to wait to timeout on the fastcgi_pass causing it to backup on incoming connections. Zooming in, we can see that PHP starts to consume sockets first, but then it plateaus, and shortly after that, nginx goes wild and starts massively ramping up on open sockets.
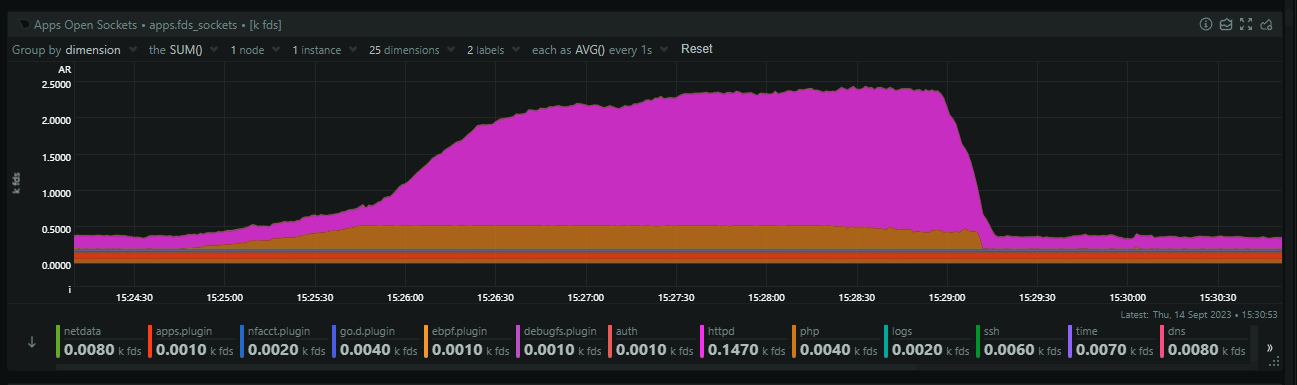
Seems like a solid theory, but, why? What could PHP possibly be doing, especially as the same truncation of POST requests is happening so it should be doing basically nothing!
Looking at the logs more closely
As you saw above, the issue started and stopped within ~1 minute and I didn't change or do anything to impact that. It also happened across our entire fleet of ingestion servers during the same window, give or take a second or two, which makes this more interesting and was suggesting an external factor to the ingestion servers. We centralise all of our logs to Papertrail so I could go and take a time-slice for these two events and look at everything that happened across all of our servers. Of course, there were many of the expected log events with the TCP: out of memory -- consider tuning tcp_mem happening across both incidents and the improved JsonException logging giving me more information too. As before, it seemed like the requests coming from Cloudflare were doing just fine and then, when they hit our origin, the problems begin.
This was when I spotted something that I'd seen before in the logs during the first incident, but noticed that these entries were also present in the second incident too. I'd been focusing on the ingestion servers but I now noticed that some of our other servers were throwing a very small number of seemingly unrelated errors at the same time. I widened the time-slice to see if these other servers were throwing the errors before and/or after the incident and it turns out, they weren't.
Sep 18 15:28:36 report-consumer-65 info.log [2023-09-18 15-28-36] We lost a batch (actually 10): cURL error 7: Failed to connect to reporturi.table.core.windows.net port 443 after 444 ms: Connection refused (see https://curl.haxx.se/libcurl/c/libcurl-errors.html) for https://reporturi.table.core.windows.net/$batch @ CLI (PID: 1657091): /var/www/html/report-uri/public/www/index.php Process @@@ git:40620dcOur consumer servers sit behind Redis and pull out batches of reports to process into Azure Table Storage, and they were receiving a variety of errors when talking to Azure. There were connection timeout errors, connection refused errors and then successful connections, but a 503 Service Unavailable response. It seemed odd that these issues were starting and stopping during the same time window that our ingestion servers were having their issues, even though the two are isolated and independent from each other. I hadn't thought to look much into our Redis server because it already has some very tight monitoring and alerting setup, and I hadn't observed any issues with it throughout. There was a minor drop in traffic from the ingestion servers during the incident, again expected, but other than, it was doing just fine. I then noticed something else in the logs.
Batches of Rejected Reports
When the Cloudflare Worker talks to our origin, there are three endpoints that reports can be sent too. We have batch_reports() which is for a batch of reports to be processed as normal into your account and visible in the Reports/Graphs pages, we have batch_wizard() which is for a batch of reports that were sent to the CSP Wizard, and then batch_reject() which is for reports that the Worker rejected and only need to be counted in your Rejected Reports metrics but not otherwise processed. The vast majority of the exceptions being thrown when parsing the JSON were for requests sent to the batch_reject() endpoint, the one that seemingly has the least to actually do! I decided to walk through the code and refresh my memory because, after all, this was written quite a number of years ago. Here are the three methods, nice and simple:
public function batch_reports(): void
{
$this->checkRequestIsPost();
$this->batch(RedisKeys::REPORTS());
}
public function batch_wizard(): void
{
$this->checkRequestIsPost();
$this->batch(RedisKeys::WIZARD());
}
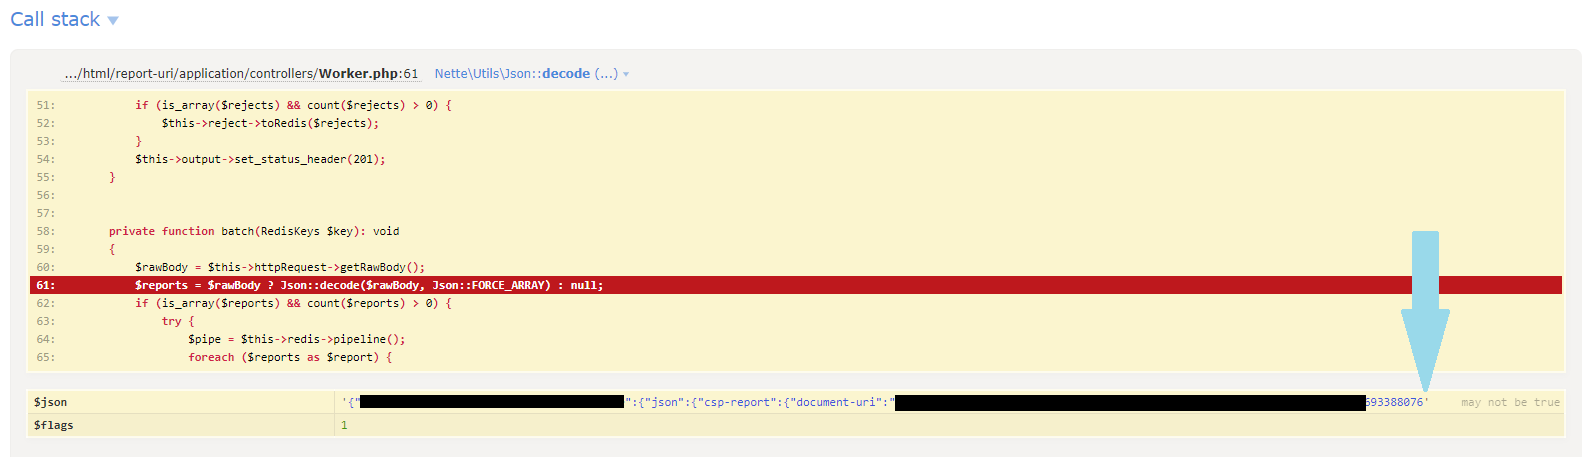
public function batch_reject(): void
{
$this->checkRequestIsPost();
$rawBody = $this->httpRequest->getRawBody();
try {
$rejects = $rawBody ? Json::decode($rawBody, Json::FORCE_ARRAY) : null;
} catch (JsonException) {
Debugger::log('Problem parsing REJECT JSON, content length: ' . $_SERVER['CONTENT_LENGTH']);
Debugger::log('Post size was: ' . strlen($rawBody));
$rejects = null;
}
if (is_array($rejects) && count($rejects) > 0) {
$this->reject->toRedis($rejects);
}
$this->output->set_status_header(201);
}As you can see, batch_reports() and batch_wizard() go straight to Redis, but batch_reject() has the extra bit of logging I'd added, yes, but it puts these reports into Redis using $this->reject->toRedis() instead. This is when I quickly started to unravel things.
A quick history lesson
The Cloudflare Worker used to buffer and pass reports to our ingestion servers, where the existence of the user would then be checked and the reports processed if a user existed to receive them, or rejected otherwise. This was a lot of load on the ingestion servers at what is the highest velocity segment of our processing pipeline, so, ~5 years ago we built a new feature so the Worker could maintain state about our users. By giving the Worker the ability to query our origin and check for the existence of a user, and then caching the result locally, we could have the Worker discard reports much sooner in the process. This is where batch_reject() came in above, using slightly different code.
We also wanted to avoid hitting Table Storage so aggressively to query the existence of a user so we implemented a service that would maintain a 'User Entity Cache' in Redis and keep it aligned with Table Storage. Now, services could query Redis instead of Table Storage and we saw some enormous performance improvements and a reduction in load on Table Storage as a result. Over time, more and more areas of our code were migrated to use this new User Entity Cache and we now have a `User Entity` service that will transparently query Redis first, and then gracefully fall back to Table Storage if needed, populating Redis in the process.
Except, this old rejected report code wasn't using that process... Calling $this->reject->toRedis() still has a direct dependency on Table Storage, despite what the name implies.
One query to rule them all
One query to find them
One query to bring them all
And in the darkness bind them
Our batch_reject() code was still using a fairly legacy approach to handling these reports and would simply grab the list of our users from Table Storage and run the list of rejected reports against the user list, counting rejected reports where users existed and discarding them otherwise. This worked pretty well, and has actually worked fine up until now. Table Storage is fast, queries are cheap, and sure, it's a bad approach, but it's never been a problem. But, we're a lot bigger now with a lot more users than before. This is where the problem came in.
A query to grab the list of all our users used to be quite a small one. Heck, when we started there was only one user in there! Over time though, that number of users has increased to hundreds, then thousands, and then tens of thousands, and now, we're closing the gap to six figures. It's become an increasingly larger query over time and, because we're talking to Table Storage, I also need to update my TCP overheads list from earlier.
- Cloudflare Worker --> TCP --> Ingestion Servers
Nginx --> TCP --> PHP- PHP --> TCP --> Redis
- PHP --> TCP --> Azure Table Storage
When I thought I'd reduced our overheads on TCP by 1/3, it was only a 1/4 reduction, and it means that those error logs from our consumer servers are now relevant. If they're having issues talking to Table Storage, then the ingestion servers probably are too.
Breaching Azure Table Storage Performance Limits
Azure Table Storage is fast, really fast, but everything has limits, and we were pushing the limits of Table Storage. The limit for Entities Per Second set by Microsoft is defined as:
The scalability limit for accessing tables is up to 20,000 entities (1 KB each) per second for an account.
A couple of things stood out to me right away here. First of all, we have tens of thousands of users, and many servers performing that query, so it's not going to be hard for us to hit 20,000 entities queried per second, but there's also a size limit. If it's 20,000 entities per second, with a 1 KB size, I assume that gives us a theoretical maximum read rate of 20 MB/s, otherwise the size wouldn't need to be specified. Our typical user entity isn't too much larger than this, at 4-5 KB, but we're definitely going to see reduced entity query rates if the size is a factor.
I went over to the Azure Portal and there is a metric available for our storage account to look at the amount of throttled transactions against our tables, and...
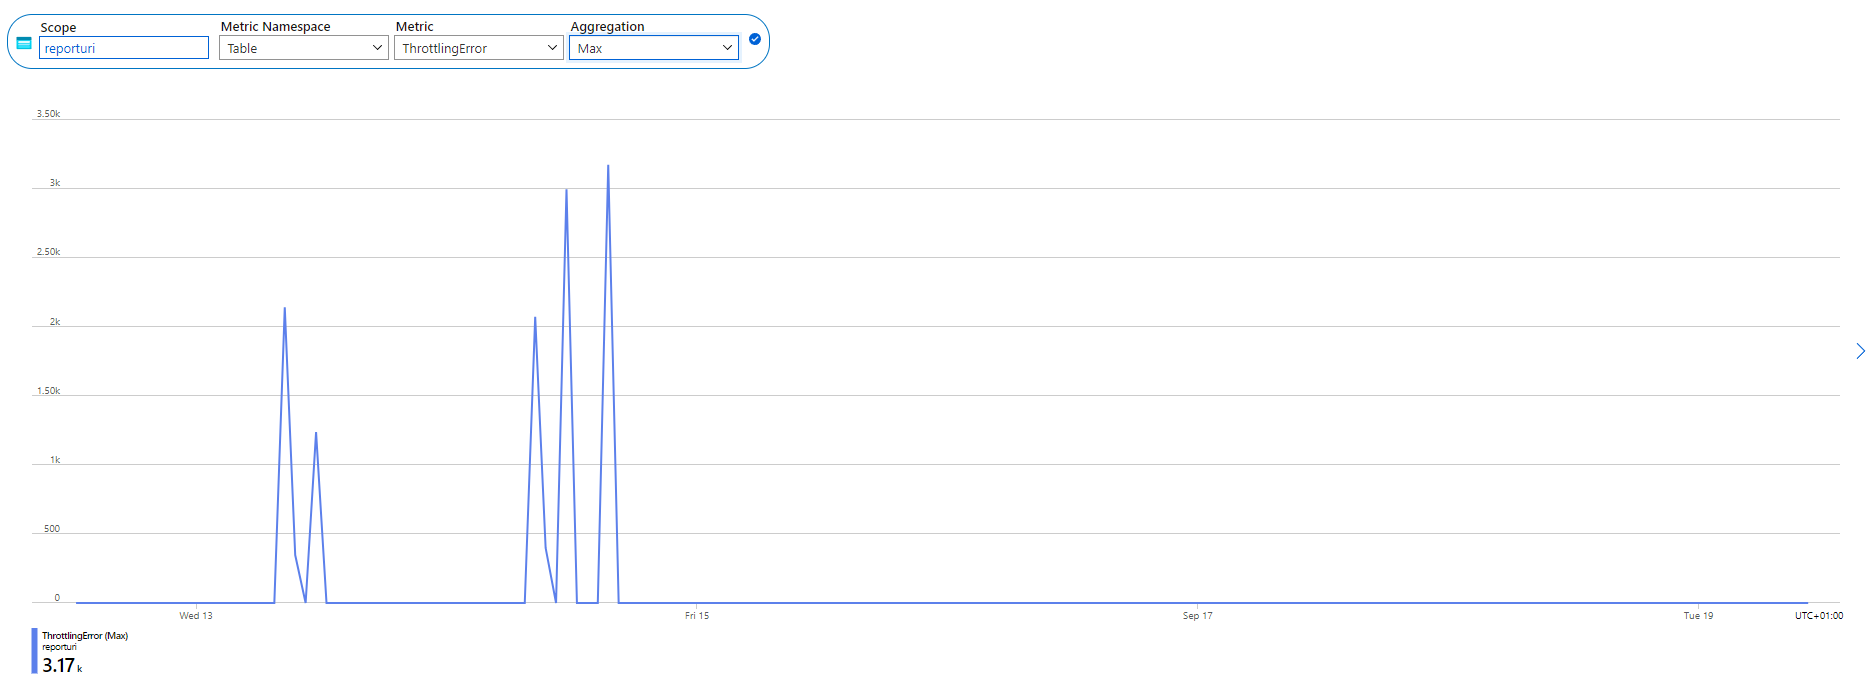
We were being throttled by Azure! I'm not sure of the specifics around how this works, and I was seeing connection timeout, connection refused and 503 errors in our logs, but those things would make sense if we were approaching the performance capabilities of Table Storage. The two larger spikes to the right also align with when I observed the issue happening, but not the other spikes. Perhaps they weren't big enough to trigger the backlog problem and we were able to ride it out, but this felt like I was on to something.
Exponential backoff
I dug into our code again to see what the behaviour would be in this scenario, where connections or transactions against Table Storage are failing, and we're using an exponential backoff. That's a sensible approach, and maybe our values need tweaking, but it's not a bad setup.
	private static function pushMiddlewares(ServiceRestProxy $service): void
	{
		$service->pushMiddleware(RetryMiddlewareFactory::create(
			RetryMiddlewareFactory::GENERAL_RETRY_TYPE, <-- retry type
			3, <-- number of retries
			1000, <-- interval in ms
			RetryMiddlewareFactory::EXPONENTIAL_INTERVAL_ACCUMULATION, <-- accumulation method
			true, <-- retry on connection failures
		));
		$service->pushMiddleware(new SanitizeExceptionMiddleware());
	}
With the connection timeouts/failures, or slow responses from Table Storage to get the 503, taking up to 1,000ms or more, coupled with this retry logic, there are easily scenarios here where PHP could be tied up for 15+ seconds. That's a lot of waiting around, and still only a good theory at this point, so it was time to test it.
Reproducing the issue locally
Because all I had was a theory, I wanted to reproduce it and see it with my own eyes. Given the relative simplicity of this problem, it shouldn't prove too hard to reproduce, so I fired up a server with the same resources as our ingestion servers and created a simple PHP script.
<?php

  $fp = fsockopen("scotthelme.co.uk", 80, $errno, $errstr, 30);

  sleep(30);

  $json = json_decode(file_get_contents('php://input'));

  if ($json == null) {
    syslog(LOG_WARNING, "JSON decode failed: " . $_SERVER['CONTENT_LENGTH'] . " " . strlen(file_get_contents('php://input')));
  }
The script needed to simulate what our ingestion servers were doing so it would:
- Receive an HTTP POST request with a JSON payload.
- Nginx would pass that to PHP via a Unix Socket.
- PHP opens a TCP connection to pressure TCP resources.
- PHP sleeps to simulate slow external connections.
- Try to parse the JSON payload.
In order to hit this endpoint with load, I created a simple bash script on my local.
#!/bin/bash
curl --location 'http://167.99.196.71/' \
-H 'Content-Type: text/plain' \
-X POST \
-d @post.data \
--insecure
The post.data file contained 1MB of valid JSON so I had a sizeable POST request to test with and then, I just needed to load up the server with requests.
$ for i in $(seq 50); do ./post.sh & doneThis would fire up 50 instances of the script at the same time and the command can be run sequentially on a time interval to progressively load up the server. It didn't take long...
Sep 18 22:57:41 delete-me kernel: [ 6910.201032] TCP: out of memory -- consider tuning tcp_mem
Sep 18 22:57:41 delete-me kernel: [ 6910.275034] TCP: out of memory -- consider tuning tcp_mem
Sep 18 22:57:41 delete-me kernel: [ 6910.624642] TCP: out of memory -- consider tuning tcp_mem
Sep 18 22:57:44 delete-me kernel: [ 6913.017896] net_ratelimit: 9 callbacks suppressed
Sep 18 22:57:44 delete-me kernel: [ 6913.017900] TCP: out of memory -- consider tuning tcp_mem
Sep 18 22:58:01 delete-me ool www: JSON decode failed: 1001553 65536
The exact same problem!! The payload was even truncated at the exact same size, which perhaps makes sense because the server has the same resources so probably the same default values around tcp_mem. This was great to see. I could reliably reproduce the problem which means that now it's identified, the fix should be good to go.
Fixing the issue
By now, it's pretty clear what the fix is and it didn't take much effort to implement the changes.
The first and immediate change was for the batch_reject() code to use the User Entity Cache service for querying the existence of users. This should all but eliminate any querying against Table Storage and even if queries were triggered, they would be to query the existence of a single user and not to query out our entire user list.
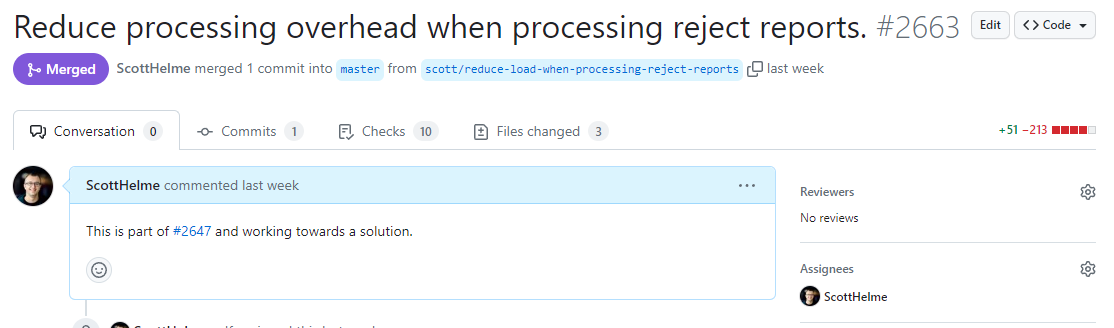
Quite a small change to make quite a big impact!
My next change will be to shift this code from the ingestion servers to the consumer servers instead. The consumers have far less pressure and given the volume of reports flowing through the ingestion servers, they just need to get out of the way and push reports into Redis as efficiently as possible. That's a ticket for another day, though, because the main focus was to avoid seeing this issue again and I'm happy to say that since the fix was deployed, it hasn't happened again. Not only that, I'm seeing a reduction in the transactions against Table Storage and generally lower CPU usage across the ingestion servers. All is good.
Phew!
That was quite the post, and I hope it was interesting to follow along! Even though the issue was finally resolved, I did still have a few questions left outstanding after this and maybe someone out there can help?
Should Nginx pass these requests through?
I never fully investigated the cause of the truncated payloads because that seemed to be a symptom of the problem rather than the problem itself. My current theory is that the inbound connections were being terminated and the partial payload received was then being processed by Nginx. In this scenario, I was surprised that Nginx would pass it through to PHP, but maybe there's a good reason for that and someone can share it below! I'd have thought that requests like this would not make it beyond Nginx and they'd show up in the error log.
Why is PHP processing these requests?
This is dependent on the answer to the above, but there is also the possibility that Nginx is sending the full request through, but I don't believe so based on the logs from Nginx, and that PHP is cutting short the payload when receiving it. Either way, I'm not sure why PHP would try to process only a partial request whether it was cut short from Nginx or PHP.
How should I tune tcp_mem?
I've read a lot about how to do this but can't say I've walked away with a definitive answer, if one even exists. Our ingestion servers have more than enough resources and no other burdens, so for now, I've given a modest increase in the pressure and high values, but they could probably do with having a little more thought put into them.
I think I've had enough of fighting fires so I'll get back to writing code and building new features 😎
Update 2nd Oct 2023: I've published a second blog post with further debugging and information - Processing Truncated Requests? A PHP Debugging Deep Dive