
Thanks to the sponsorship provided by Venafi for this post, we have another Top 1 Million Analysis just 6 months after the last one in November 2021! Let's take a look at what's changed in the last 6 months and see if there are any new trends emerging.
The Crawl
As with all of my previous reports, the data for this report was taken from my Crawler.Ninja project. You can head over to the site and get the raw data from every single crawl that I've done daily for over 7 years!!

One of the problems with running these crawls, storing that much data and writing these reports is that all of those activities require resources in either time, money, or both. I've struggled to set aside time for projects recently so the support from Venafi has been fundamental in making sure I can carve out time to continue this work and make it available for free to everyone!
Venafi
As I mentioned in my previous Top 1 Million Analysis in November 2021, Venafi noticed I hadn't done one for a while and reach out to see why. When I explained it was just a time and funding shortage, they stepped up to help by funding two reports, with this being the second of the two!
As with the first report, this one will also be cross-posted onto the Venafi site so be sure to stop by and show them some appreciation for supporting my work.
June 2022
In the last report in November I hadn't done an analysis for ~18 months and as a result, we saw some pretty big changes. Because it's only been 6 months since the Nov 2021 report, we're going to see some smaller changes this time around and something else is becoming clear in the data.
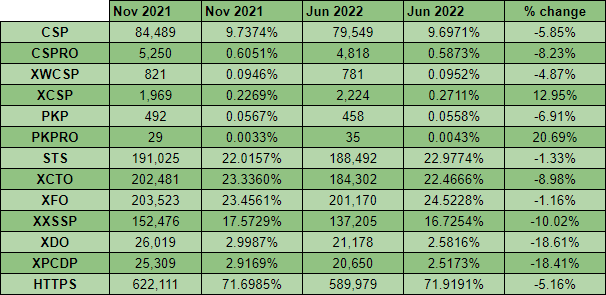
Looking at the numbers here, it might seem at first glance that things are moving backwards, but looking a little bit deeper at the data, we can see that things have plateaued. The crawler had a marginally higher failure rate for the day in question (June 3rd) than it did for the scan back in Nov 2021 so whilst, for example, the number of sites with a CSP seems to be lower, it you factor in the failure rate, it has remained pretty constant.
HTTPS
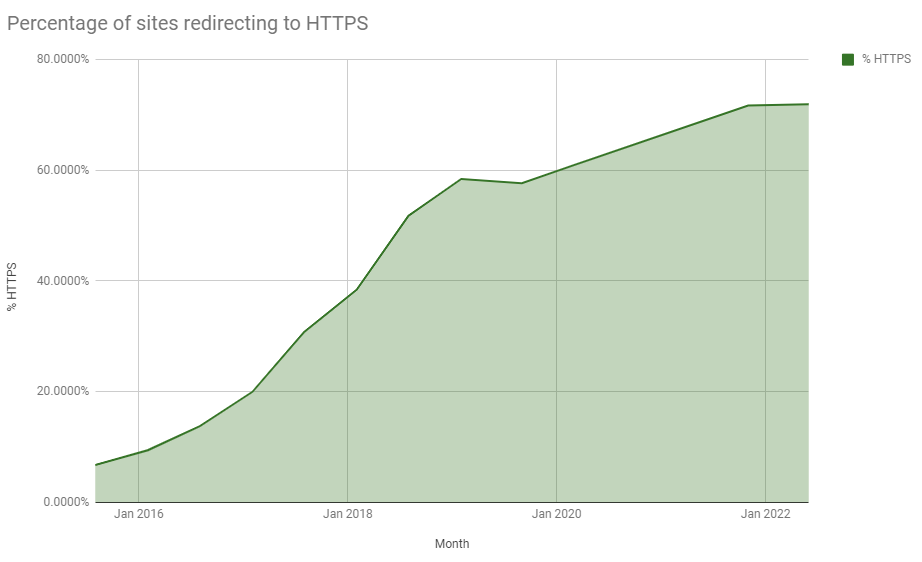
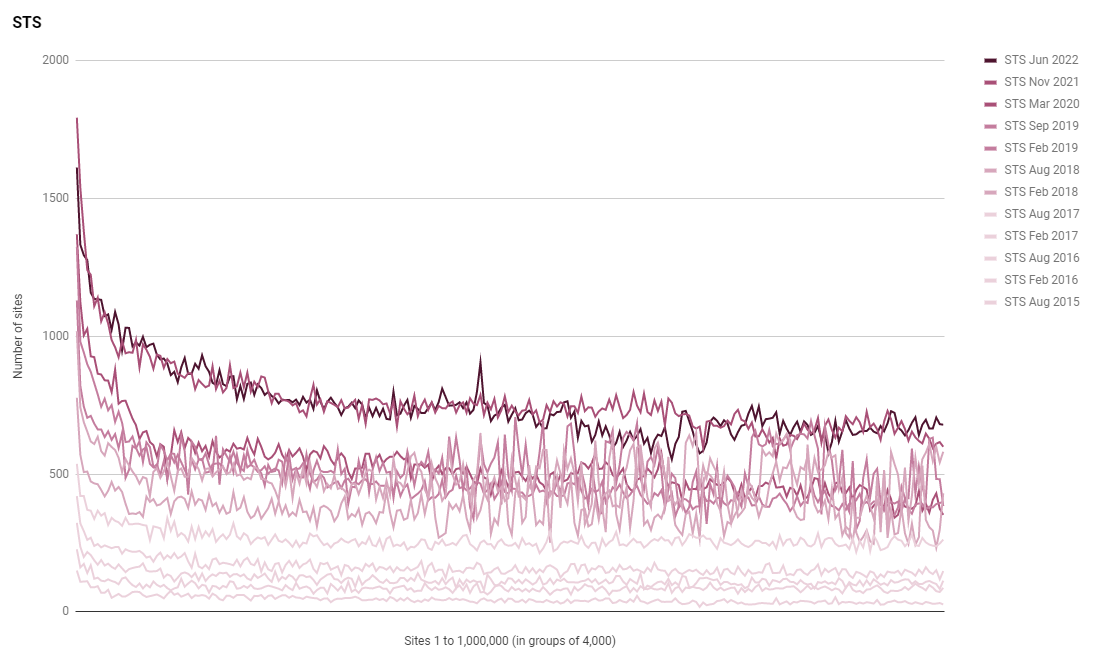
As we may have expected over the last few years, the progress of deploying encryption across the Web has slowed significantly. Again, we have to factor in the transient error rate of the crawler, but if we do that, we can see that very little progress has been made in deploying more encryption over the last 6 months.
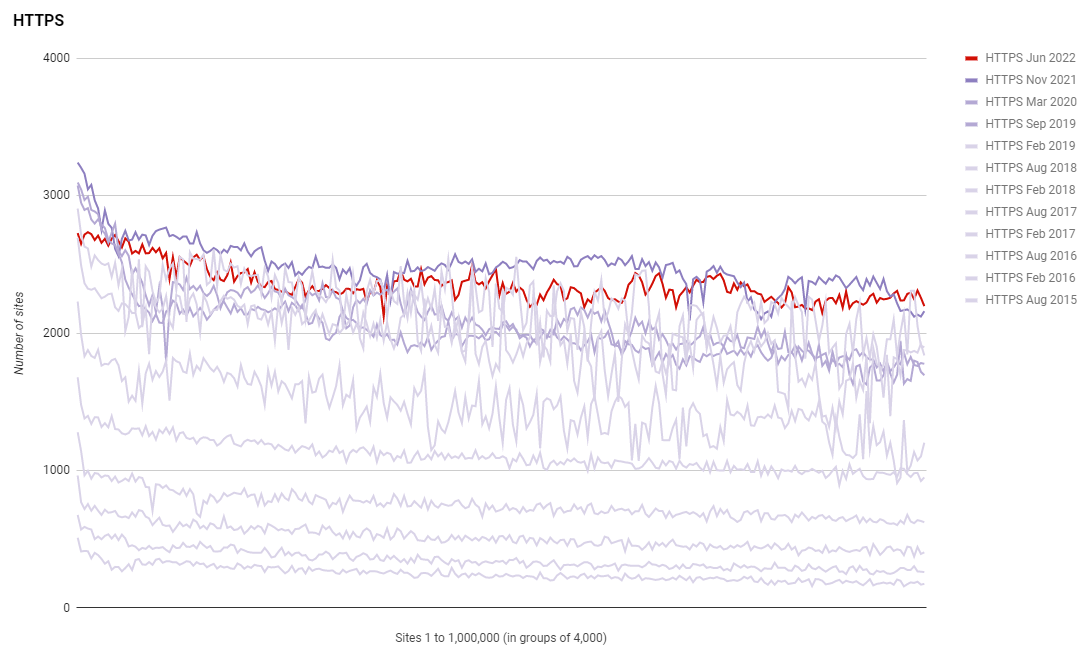
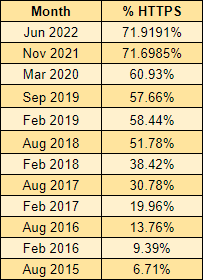
This is both a good thing and a bad thing as we have made phenomenal progress over the last few years in getting the vast majority of the Web encrypted, but, we're now slowing significantly as we approach ~75% of sites using HTTPS. I continue to speculate on whether these are just sites that nobody is maintaining, but then, how do they remain in the Top 1 Million sites online? It's certainly an interesting question, for which I don't currently have an answer, but here's a better look at the plateau in our progress.
HTTP Strict Transport Security
As we have seen historically, the trends with the adoption of other security mechanisms follow closely to the deployment of HTTPS and HSTS has continued to do so.
The June 2022 scan shows us that the rate of usage of HSTS has plateaued with HTTPS, which makes sense as HTTPS is a prerequisite for HSTS, but I have a feeling this trend will continue into other metrics too.
Certificates
After seeing tremendous success since starting in 2015, Let's Encrypt have stormed to the top of leader board for the number of sites using them. In this latest analysis, Let's Encrypt remain at the top of the leader board and maintain their advantage.
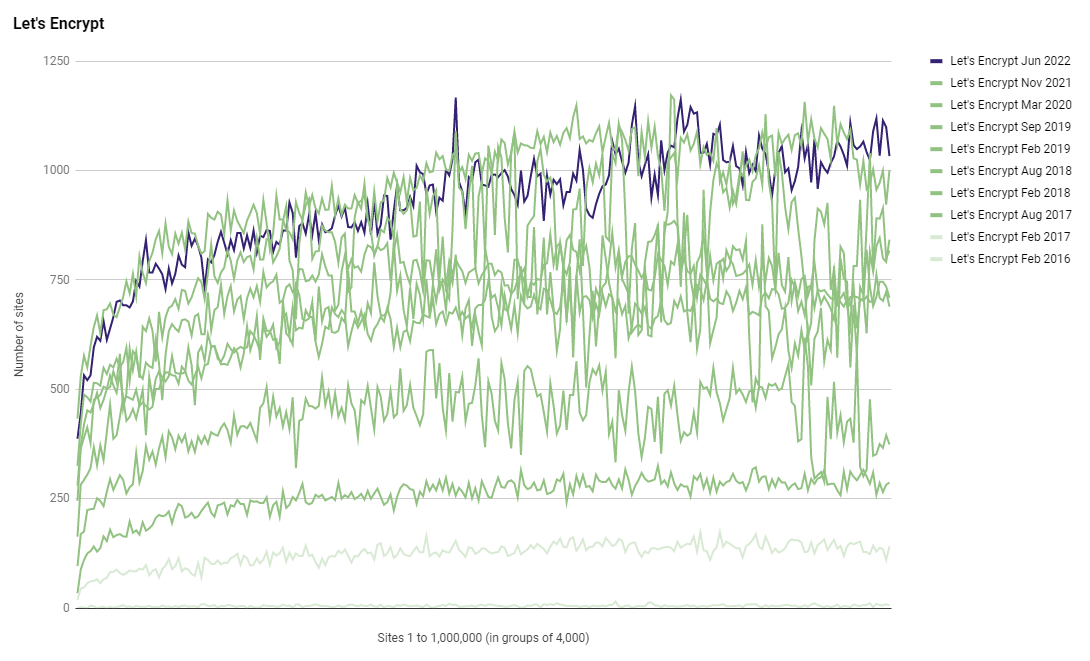
Whilst Let's Encrypt do stay out in the lead, we can see that Cloudflare has made up some ground and closed the gap a little, at the cost of other CAs in the list. Another interesting point to note is the seemingly rapid rise in the ECDSA intermediate for Let's Encrypt doing a noticeable amount of issuance. Back in Nov 2021 the E1 intermediate didn't even make it into the top 10 issuers but this time around it has jumped right in at number 5!
C = US, O = Let's Encrypt, CN = R3 209,527
C = US, O = "Cloudflare, Inc.", CN = Cloudflare Inc ECC CA-3 138,081
C = GB, ST = Greater Manchester, L = Salford, O = Sectigo Limited, CN = Sectigo RSA Domain Validation Secure Server CA 37,423
C = US, O = Amazon, OU = Server CA 1B, CN = Amazon 29,053
C = US, O = Let's Encrypt, CN = E1 20,273
C = US, ST = Arizona, L = Scottsdale, O = "GoDaddy.com, Inc.", OU = http://certs.godaddy.com/repository/, CN = Go Daddy Secure Certificate Authority - G2 19,990
C = US, ST = TX, L = Houston, O = "cPanel, Inc.", CN = "cPanel, Inc. Certification Authority" 16,837
C = US, O = DigiCert Inc, CN = DigiCert TLS RSA SHA256 2020 CA1 12,716
C = US, O = DigiCert Inc, CN = RapidSSL TLS DV RSA Mixed SHA256 2020 CA-1 8,071
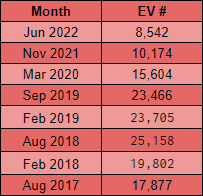
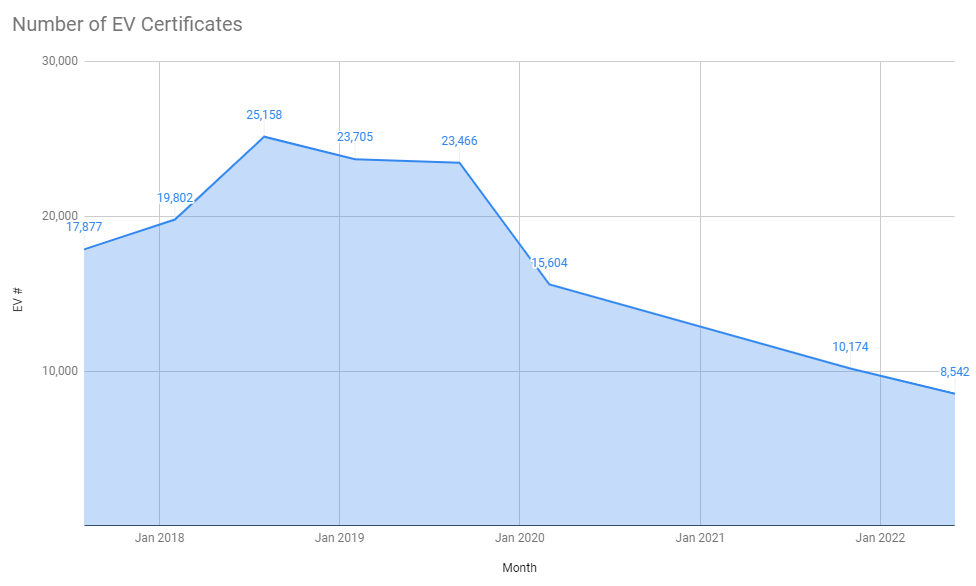
C = US, O = DigiCert Inc, OU = www.digicert.com, CN = Encryption Everywhere DV TLS CA - G1 5,246Whilst the absolute number of sites using HTTPS hasn't really changed, and thus the number of sites using certificates hasn't really changed, we still continue to see a decline in the use of EV certificates.
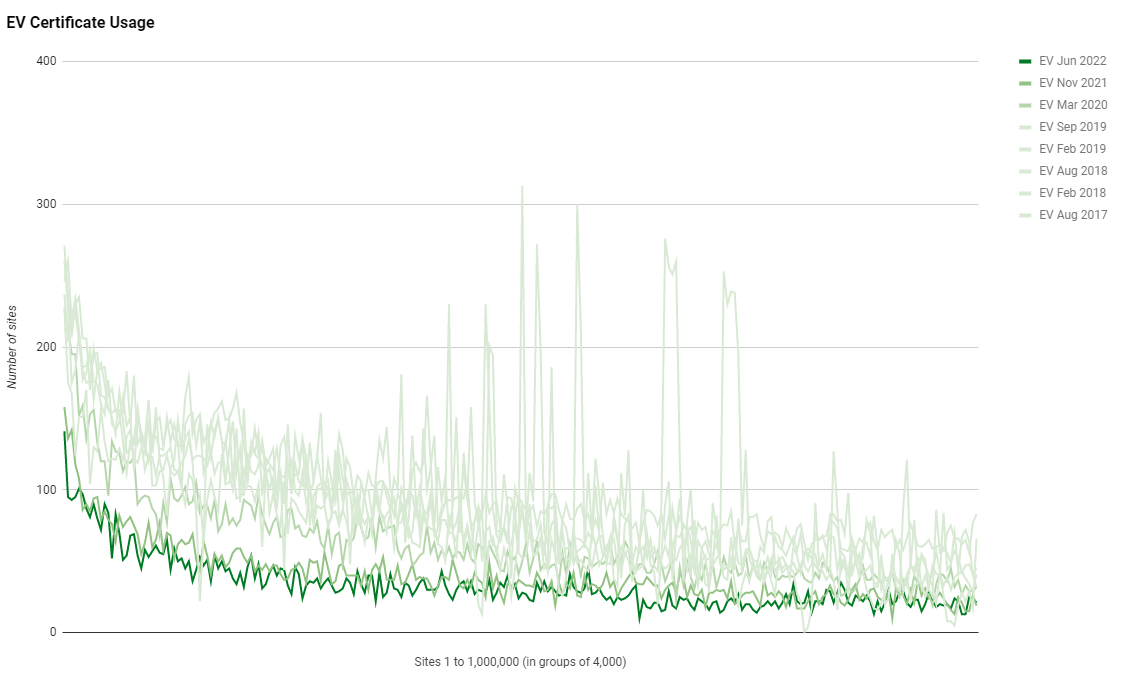
This is really quite noticeable when you look at the absolute numbers and even factoring in the success/failure rate of the crawler, there is still quite a significant decline in the use of EV certificates.
Certificate Authority Authorisation
Whilst we haven't seen much growth in the use of HTTPS and certificates, the usage of CAA has been quite low in recent years so there is some opportunity for significant growth in the use of CAA and we have seen some increase in adoption.
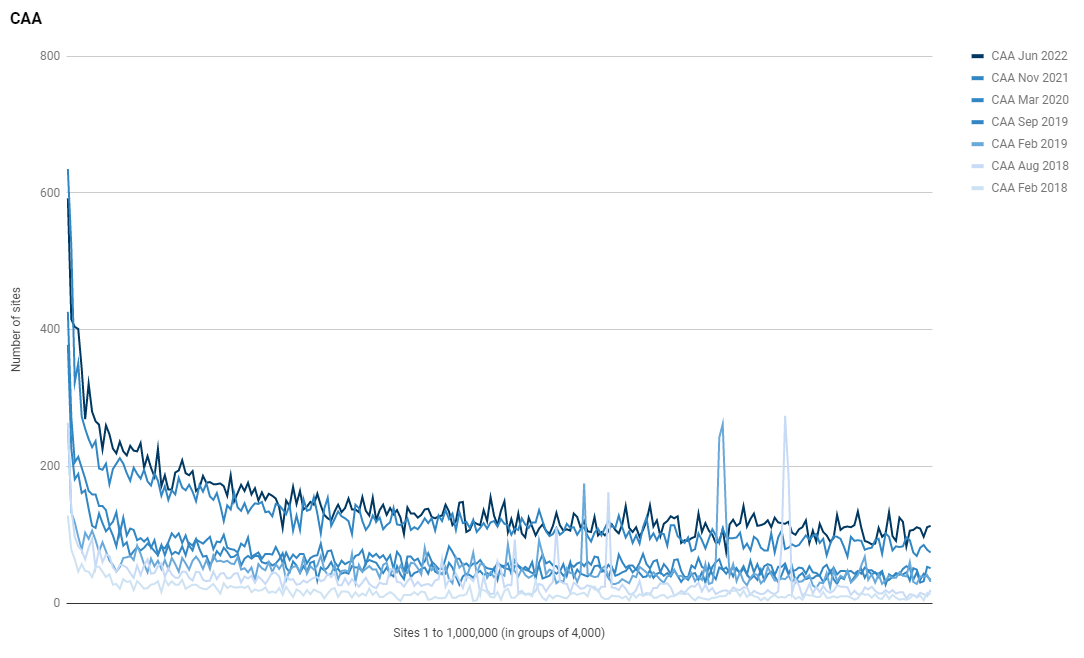
In Nov 2021, only 31,533 sites were using CAA but in Jun 2022 that number has risen to 35,537 which is almost a 13% increase! Looking at the 5 most common CAA configurations, it seems that Google owned properties might be responsible for most of that increase, but Let's Encrypt continue to show their dominance even in the CAA records!
CAA 0 issue "digicert.com; cansignhttpexchanges=yes"
CAA 0 issuewild "digicert.com; cansignhttpexchanges=yes"
CAA 0 issue "comodoca.com"
CAA 0 issue "letsencrypt.org"
CAA 0 issue "pki.goog; cansignhttpexchanges=yes"
CAA 0 issuewild "comodoca.com"
CAA 0 issuewild "letsencrypt.org"
CAA 0 issuewild "pki.goog; cansignhttpexchanges=yes"
6,226
CAA 0 issue "letsencrypt.org"
3,062
CAA 0 issue "digicert.com; cansignhttpexchanges=yes"
CAA 0 issuewild "digicert.com; cansignhttpexchanges=yes"
CAA 0 issue "comodoca.com"
CAA 0 issue "letsencrypt.org"
CAA 0 issuewild "comodoca.com"
CAA 0 issuewild "letsencrypt.org"
1,460
CAA 0 issue "comodoca.com"
CAA 0 issue "digicert.com; cansignhttpexchanges=yes"
CAA 0 issue "letsencrypt.org"
CAA 0 issue "pki.goog; cansignhttpexchanges=yes"
CAA 0 issuewild "comodoca.com"
CAA 0 issuewild "digicert.com; cansignhttpexchanges=yes"
CAA 0 issuewild "letsencrypt.org"
CAA 0 issuewild "pki.goog; cansignhttpexchanges=yes"
1,227
CAA 0 issue "pki.goog"
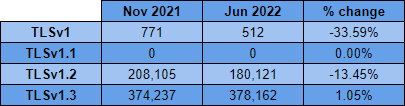
555TLS versions
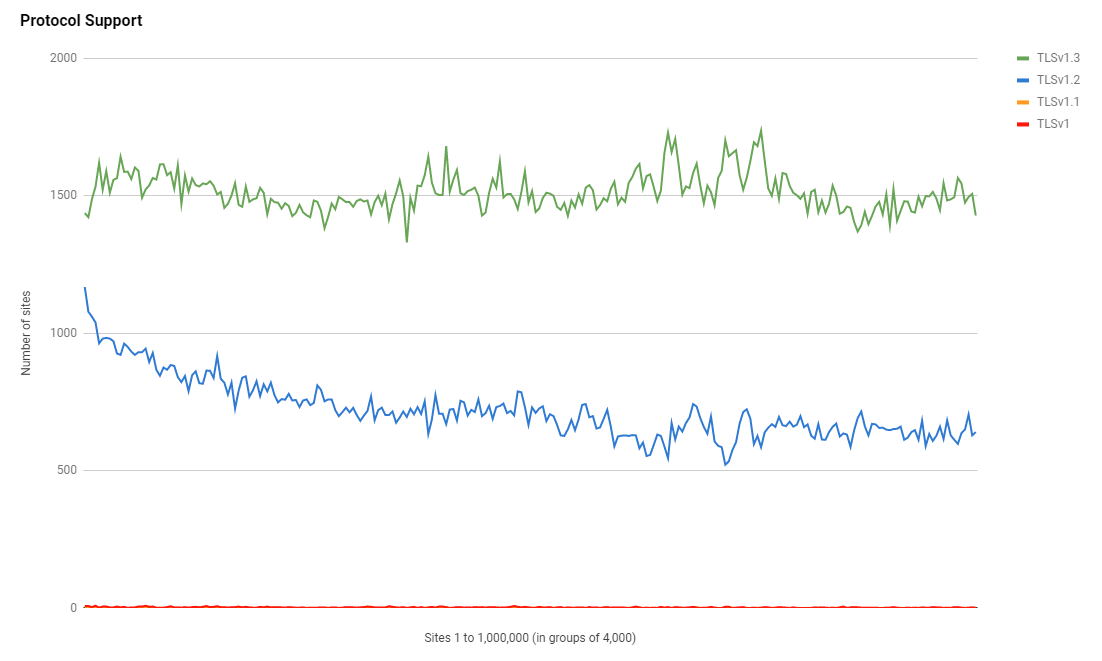
Whilst TLSv1.2 was clearly the protocol of choice a couple of years ago, it's safe to say that TLSv1.3 is now the favourite protocol with over 2x as many sites choosing it.
Despite the slow down in the adoption of HTTPS, TLSv1.3 has continued to see an increase in adoption meaning that the sites using HTTPS are upgrading their TLS protocol versions over time. If we take a look at the top 10 server header values for sites that use TLSv1.3, we can see why that might be.
SELECT server, count(*) as count FROM `results` WHERE protocol = "TLSv1.3" GROUP BY server ORDER BY count DESC| server | count |
|---|---|
| cloudflare | 165,484 |
| nginx | 66,440 |
| Apache | 45,532 |
| NULL | 19,224 |
| LiteSpeed | 16,050 |
| AmazonS3 | 4,337 |
| openresty | 3,327 |
| nginx/1.18.0 (Ubuntu) | 2,930 |
| Apache/2.4.41 (Ubuntu) | 2,899 |
| Apache/2.4.29 (Ubuntu) | 2,652 |
Almost 50% of the sites that support TLSv1.3 are using Cloudflare as their CDN provider who will make sure they have TLSv1.3 support without any additional work. It's quite a sizeable chunk of the modern protocol support that we might not have otherwise.
Cipher Suites
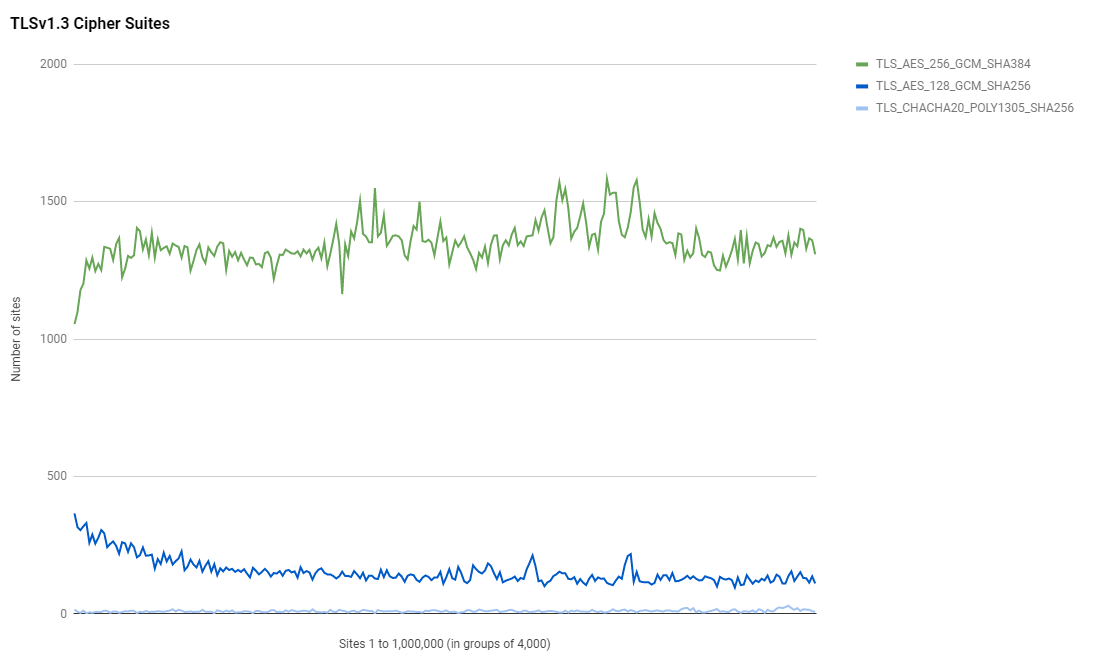
As we saw in the previous report, and given the huge increase in support for TLSv1.3 shown above, it's no surprise to see a TLSv1.3 cipher suite topping the charts as the most popular cipher suite.
Cipher Suites:
TLS_AES_256_GCM_SHA384 335,562
ECDHE-RSA-AES256-GCM-SHA384 91,705
ECDHE-RSA-AES128-GCM-SHA256 63,499
TLS_AES_128_GCM_SHA256 38,520
ECDHE-RSA-AES256-SHA384 7,756
ECDHE-RSA-CHACHA20-POLY1305 7,556
TLS_CHACHA20_POLY1305_SHA256 2,532
ECDHE-ECDSA-CHACHA20-POLY1305 2,292
ECDHE-ECDSA-AES256-GCM-SHA384 1,720
DHE-RSA-AES256-GCM-SHA384 1,203
ECDHE-ECDSA-AES128-GCM-SHA256 828
AES256-GCM-SHA384 451
ECDHE-RSA-AES128-SHA256 432
AES256-SHA256 416
ECDHE-RSA-AES256-SHA 298
AES128-GCM-SHA256 293
AES128-SHA256 275
ECDHE-RSA-AES128-SHA 207
DHE-RSA-AES128-GCM-SHA256 136
DHE-RSA-AES256-SHA256 9
DHE-RSA-CHACHA20-POLY1305 8
ECDHE-ECDSA-AES256-SHA 3
DHE-RSA-AES128-SHA256 2
ECDHE-ECDSA-AES256-SHA384 1
ECDHE-ECDSA-AES128-SHA 1
ECDHE-ECDSA-AES128-SHA256 1
The top two cipher suites both remain an AES256 suite with the TLSv1.3 suite in top position and the TLSv1.2 suite behind it in second position. What is interesting is that whilst the AES256 suite wins out in absolute numbers, for the highest ranked sites in the world there is a clear preference for the AES128 version of the suite.
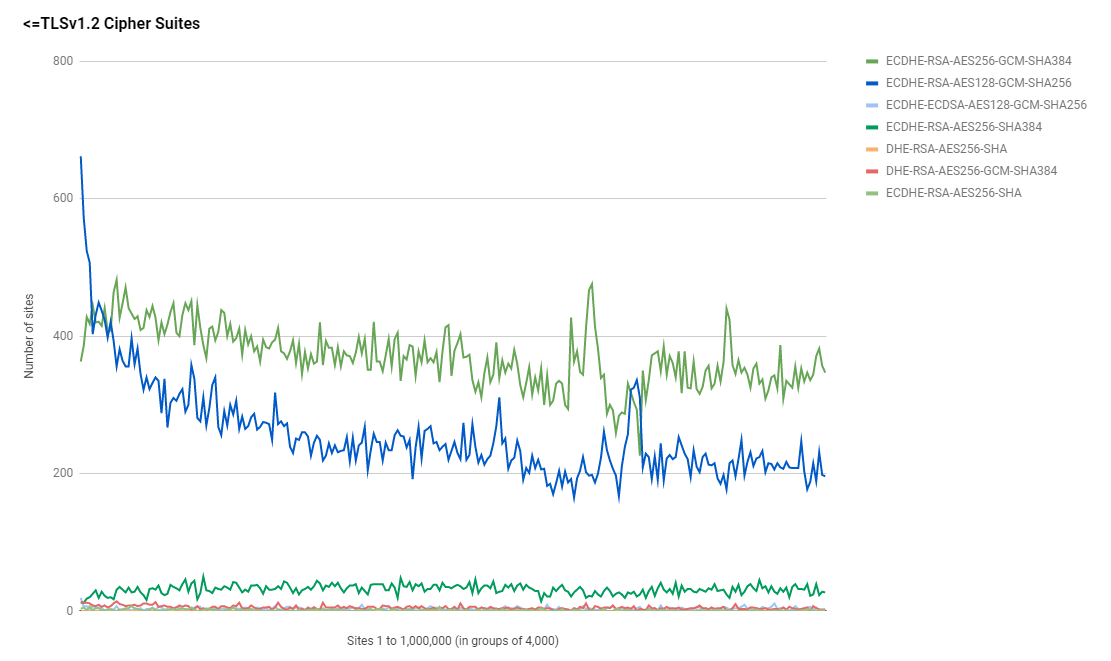
The same pattern is also visible for the TLSv1.3 suites where the largest ranked sites have a clear preference for the AES128 version over the AES256 version.
Authentication Keys
Given the continued rise in TLSv1.3, which you could reasonably assume is largely driven by performance gains, and the clear preference for AES128 suites by the most highly ranked sites, I expected to see more of a change in the type and size of keys used for authentication. RSA keys continue to be the most popular choice but it is good to see that ECDSA is closing the gap as more sites make the change from the older and slower RSA to the more secure and faster ECDSA.
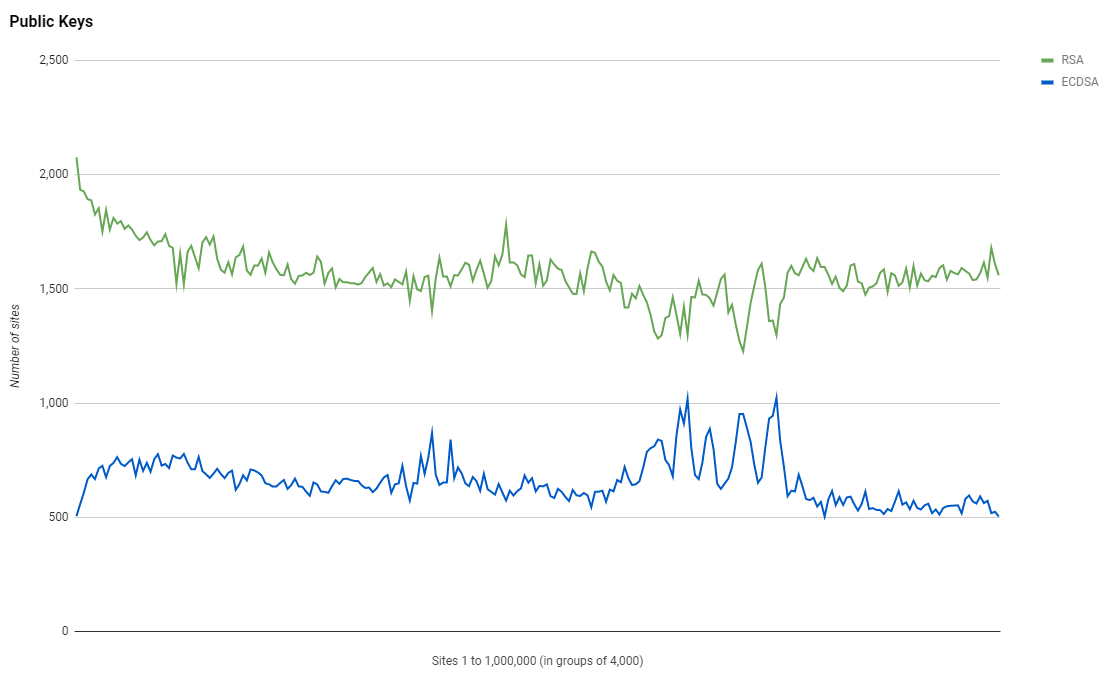
If we break it out and look at individual key sizes we can see that ECDSA is almost catching RSA in some lower ranked groups of sites, which is quite an interesting pattern to observe that I can't explain without a lot more investigation.
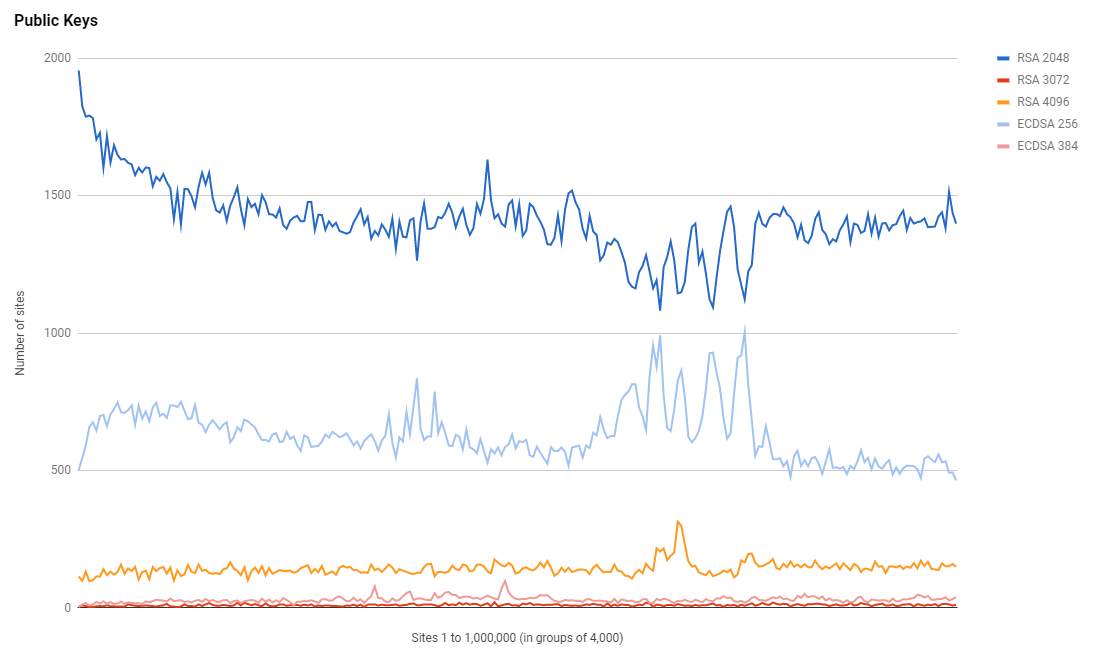
I took a look at the issuer for the RSA 4096 and it seems that Let's Encrypt is by far the most popular choice, which leads me to guess that these are individual sites obtaining their own certs rather than a cert provisioned by a hosting provider.
SELECT ca, count(*) as count FROM `results` WHERE authKeySize = "4096 bit" GROUP BY ca ORDER BY count DESCC = US, O = Let's Encrypt, CN = R3
22,595
C = GB, ST = Greater Manchester, L = Salford, O = Sectigo Limited, CN = Sectigo RSA Domain Validation Secure Server CA
3,175
C = BE, O = GlobalSign nv-sa, CN = AlphaSSL CA - SHA256 - G2
1,494
C = US, ST = Arizona, L = Scottsdale, O = "GoDaddy.com, Inc.", OU = http://certs.godaddy.com/repository/, CN = Go Daddy Secure Certificate Authority - G2
835
C = BE, O = GlobalSign nv-sa, CN = GlobalSign GCC R3 DV TLS CA 2020
707It's also the same when I look at the server header for sites using RSA 4096 in that there is no clear indicator of a platform or hosting provider doing this.
| server | count |
|---|---|
| nginx | 12,113 |
| Apache | 5,645 |
| LiteSpeed | 2,932 |
| NULL | 2,280 |
| Apache/2 | 1,588 |
I think this definitely merits some further investigation in the future to see if it's possible to identify a common pattern here. These sites are definitely paying a performance penalty using a key like RSA 4096 or RSA 3072 and the switch to ECDSA isn't really difficult either.
Security Headers
This whole crawler project began due to my desire to look at the use of HTTP Security Headers across the Web and Security Headers is still the scanning engine responsible for that.
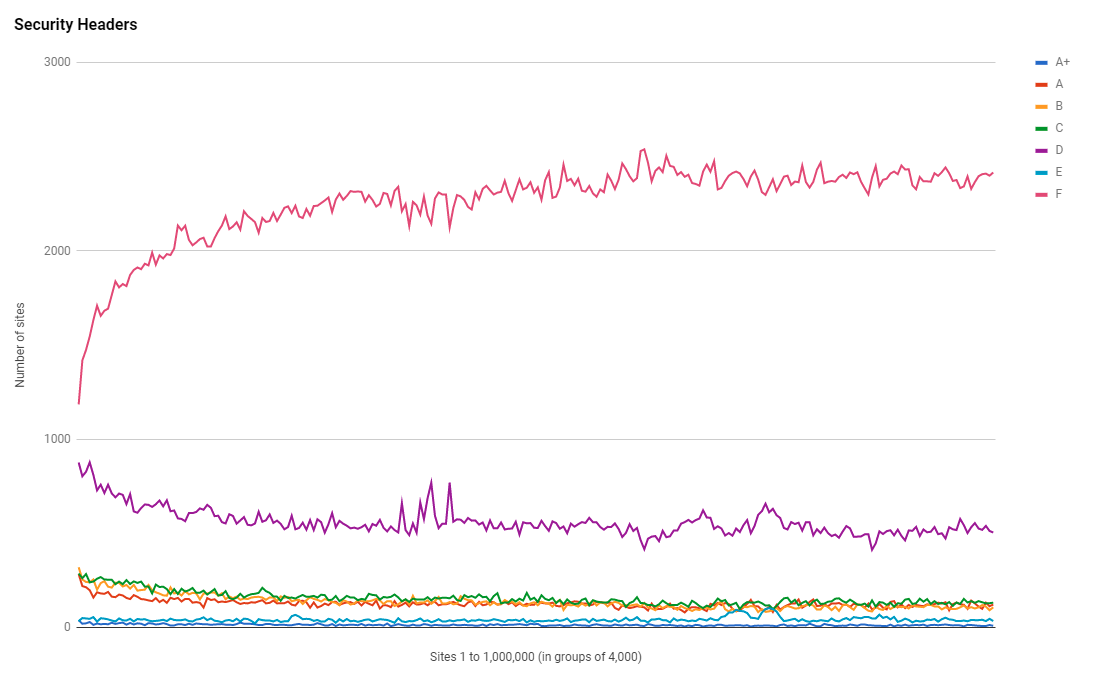
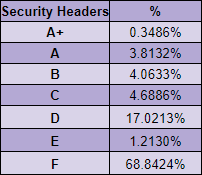
Having done over 200,000,000 scans initiated by users, for free, on the main site, Security Headers are obviously understood to be important factors of the security of a site. With that said, we are observing a reduction in the rate at which sites are adopting these important security measures.
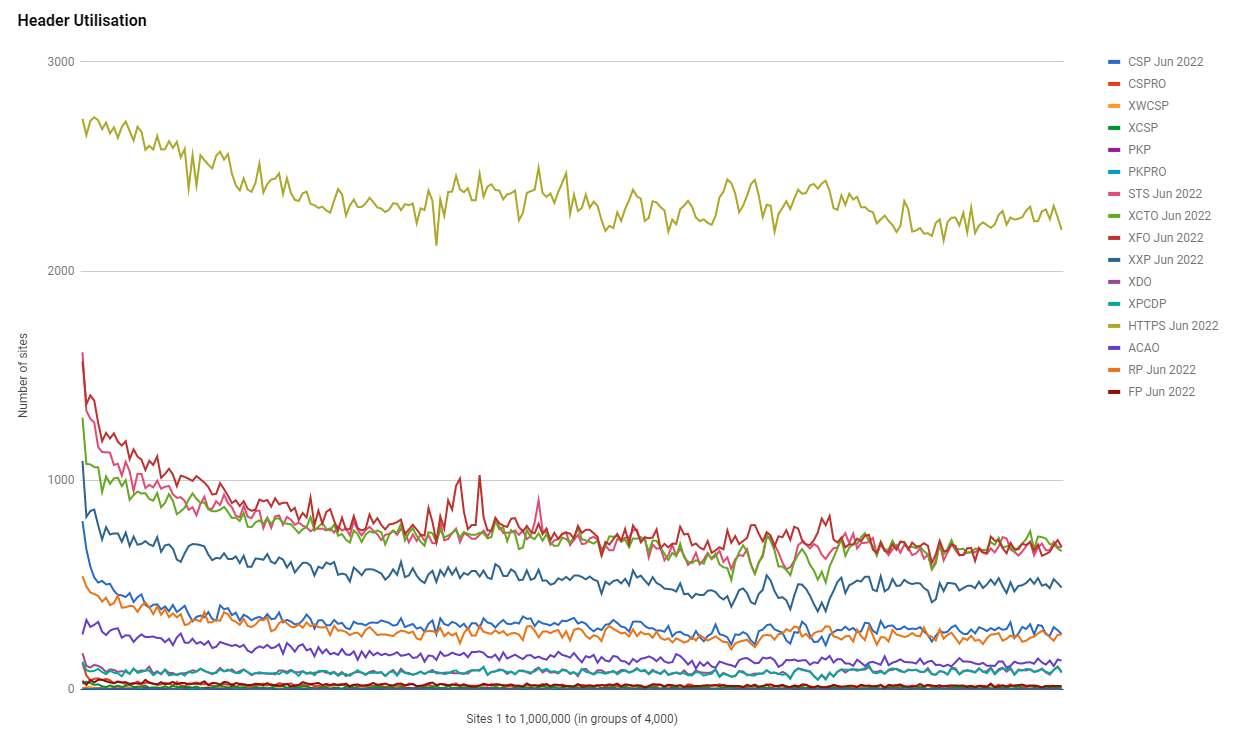
Much like the adoption of HTTPS has slowed down to almost a halt, we're seeing a very similar pattern with Security Headers too. Of course, headers like HSTS are dependent on HTTPS, so there is a direct impact there, but headers like CSP are becoming increasingly important and also seeing a slowdown in adoption.
I'm hoping that with recent pushes to use technologies like CSP and SRI from the PCI DSS, we might see some of that pace regained in the coming year or two, but for now, it certainly seems like we're approaching a neutral point.
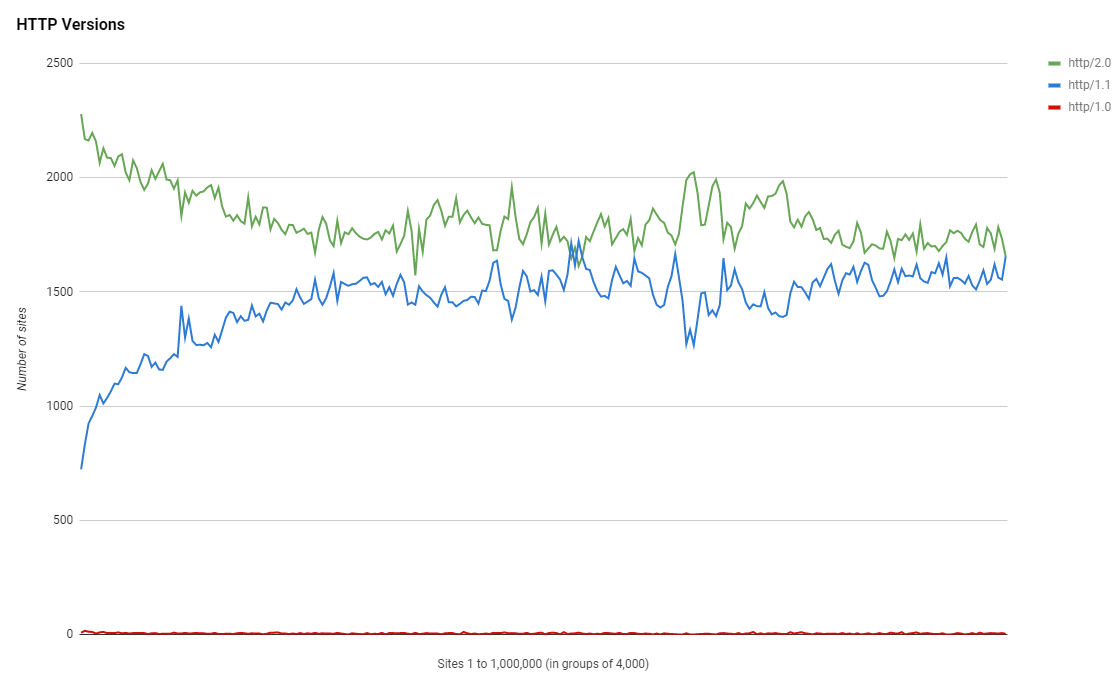
HTTP Versions
Now that the crawler has been monitoring the HTTP version a site supports for some time, we can start to look at progress over time. Compared to the Nov 2021 results, and factoring in the error tolerance, things have been pretty static in terms of HTTP/2 adoption over the last 6 months.
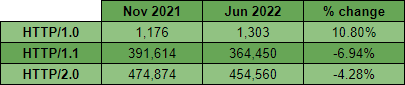
The absolute numbers of sites remains pretty static with only a tiny increase in HTTP/1.0 to be seen. Looking at the top server headers for sites with a HTTP/2.0 version, we can see a similar pattern emerging to the TLS protocol support mentioned earlier.
SELECT server, count(*) as count FROM `results` WHERE httpVer = "http/2.0" GROUP BY server ORDER BY count DESC| server | count |
|---|---|
| cloudflare | 180,461 |
| nginx | 91,817 |
| Apache | 39,939 |
| NULL | 30,482 |
| LiteSpeed | 18,027 |
| Microsoft-IIS/10.0 | 9,861 |
| openresty | 8,629 |
| AmazonS3 | 5,329 |
| nginx/1.18.0 (Ubuntu) | 2,649 |
| nginx-reuseport/1.21.1 | 2,646 |
It seems like there's a definite boost in support for another modern protocol version thanks to Cloudflare and it's the sites that are the most highly ranked where support is the greatest.
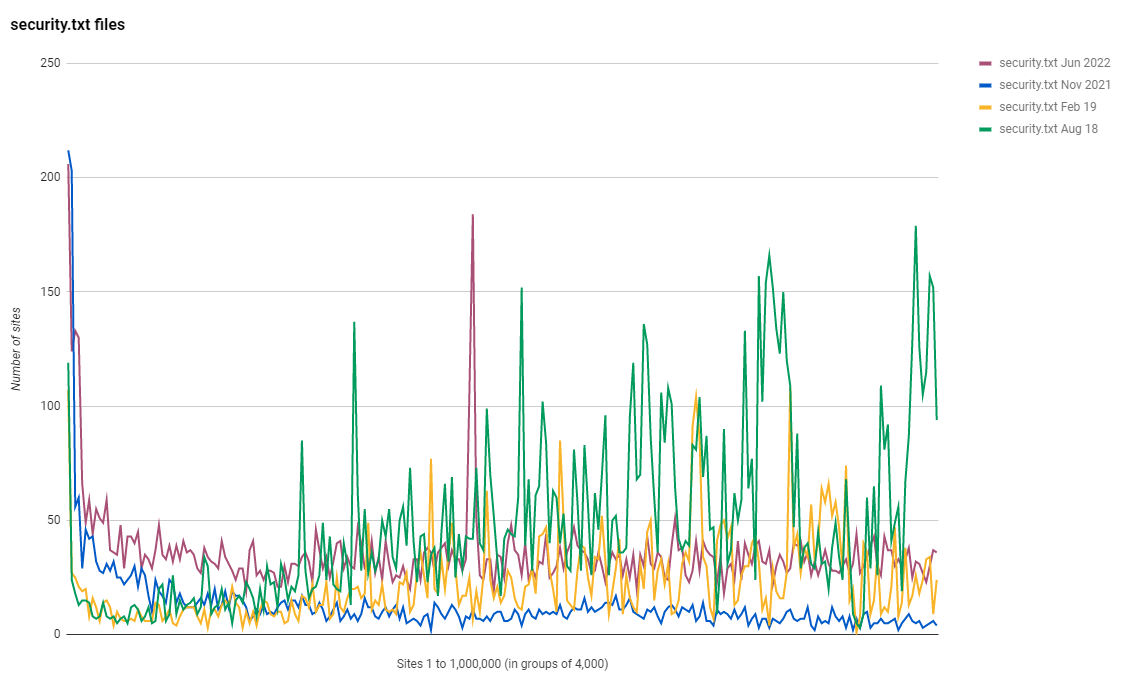
Security.txt files
Another great improvement this time around is the number of sites that are now using a security.txt file. We've seen a nice increase across the rankings in sites using security.txt and I hope we can continue to drive adoption.
Cloudflare
Given the patterns I observed in some of the above metrics, where sites using TLSv1.3 or HTTP/2.0 had a tendency to be using Cloudflare, I thought I'd run a quick query to see what the distribution in the use of Cloudflare was.
SELECT concat((`datagrp`*4000+1),'-',(`datagrp`*4000)+4000) AS 'Range', SUM(case when `server` LIKE "%cloudflare%" then 1 else 0 end) AS 'Cloudflare' FROM (SELECT FLOOR((rank-1) /4000) AS `datagrp`, rank, server FROM `results`) `s` GROUP BY `datagrp`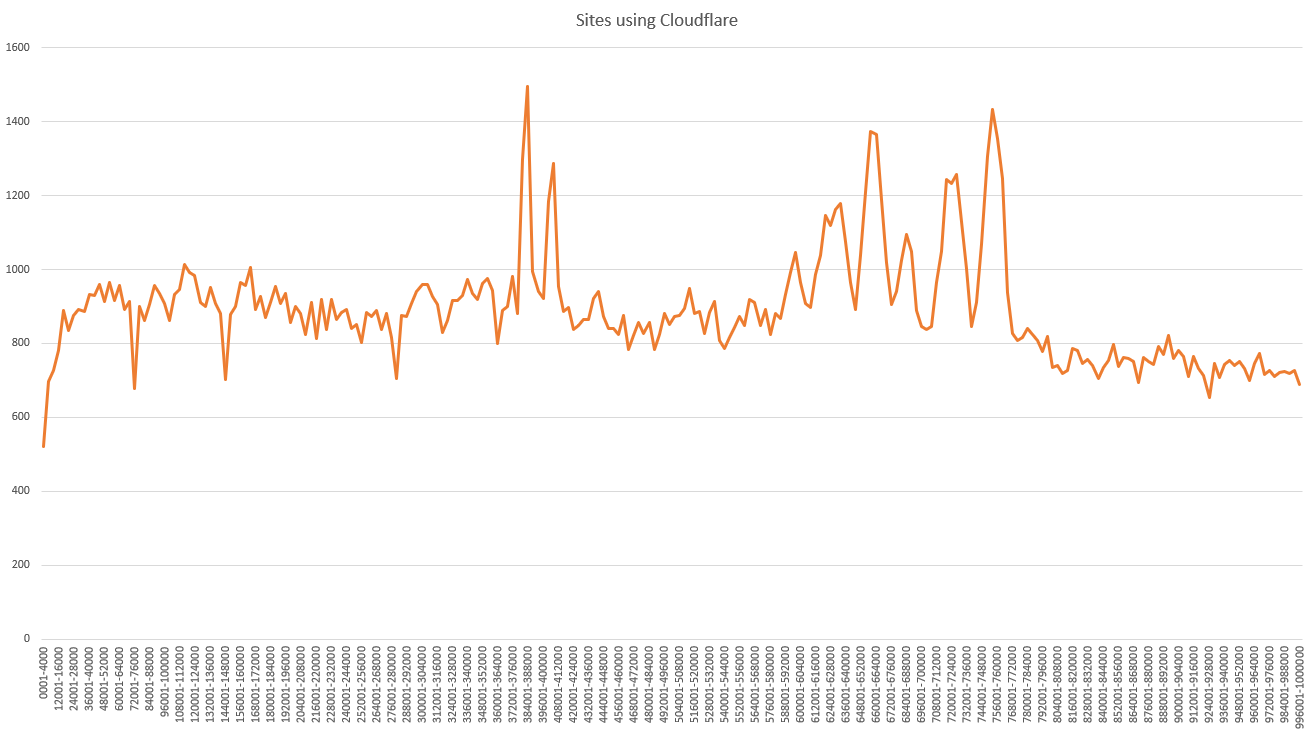
As with other metrics, this graph is showing how many sites use Cloudflare in each group of 4,000 sites, starting with the highest ranked 4,000 sites on the left of the y-axis, and the lowest ranked 4,000 sites on the right of the y-axis. We can easily see that in the highest ranked sites on the Web, Cloudflare has a lower presence, they don't really find their stride until we get beyond the top 30,000 sites. From there, we have a pretty steady ~23% of sites using Cloudflare with the odd spike where as many as ~38% of sites in a group of 4,000 are using Cloudflare. I'd be curious to investigate further and see what those spike are caused by, perhaps a particular hosting/platform provider that uses Cloudflare, but the data is open and available for anyone who might be interested to do that!
Other Observations
In my usual tradition of writing a blog post that's a little too long, I wanted to just drop in some quick fire observations of things that interest my or caught my eye when doing the analysis but without going into them too deeply in the interest of time!
Expired Certificates
My crawler produces a daily list of sites that were serving an expired certificate at the time of the crawl and wouldn't be available. The crawler also produces a list of sites with certificates that will expire within 1 day, 3 days and 7 days, but you can bet that if a site has a certificate with less than 30 days left, they've probably forgotten and it will be expire before anyone notices. From the list of sites that were serving an expired certificate I grabbed 3 that were the most highly ranked sites, all in the top 30,000 sites, and sure enough, they all had expired certs!
I'd have hope that expired certificates would be becoming more rare, not more popular!
The Plateau
It is sad to write about, especially after seeing so many years of such great progress, but a lot of the metrics I track in this report have certainly slowed in their adoption, and some have peaked. I guess we could never keep up tremendous progress forever, but I would have like to see many of these metrics get a lot higher than they are before starting to see progress slow so much. All of the data is available and anyone out there is invited to do an even deeper dive than I do here, but for now, I'm felling a little bit apprehensive about the next report might bring!
Get the data
If you want to see the data that these scans are based on then there are several things to check out. All of the tables/graphs/data that this report was based on are available on the Google Sheet here. The crawler fleet itself and the daily data is available over on Crawler.Ninja so head over there for those. There's also a full mysqldump of the crawler database with the raw crawl data for every single scan I've ever done, almost 6TB of data, available via the links on the site which means if you want to do some additional analysis the data is there for you to use!
If you just want to have a quick glance through some interesting data, I'd highly recommend the daily crawl summary which allows you to quickly and easily check up on all of the metrics that I discussed above and more.